How Application Insights recognizes returning users and efficiently send telemetry data to Azure
In this blog post, I'll provide some information how Application Insights works under the hood. I think it’s good to understand how data is sent to Azure and to know which configurations are available so you can adjust and override the default behavior. I’ll cover three different topics. First I'll explain how Application Insights collect telemetry data for user sessions and how returning users are recognized. I continue with explaining how telemetry data is sent efficiently to Azure by using buffers. Lastly, I’ll cover data sampling which reduces the amount of data that is sent to Azure and eventually reduce the monthly costs. There are three different flavors of data sampling that can be used and each have a different effect on the collected telemetry data.
Cookies are created to determine user sessions and returning users
In the portal of Application Insights, there are many new blades available that provide information about how users are using your website. For example, which pages a user visited during a session, how many returning users you have and many more information. In this section, I’ll explain how user information is sent with tracked telemetry data. Let’s first focus how Application Insights determines that telemetry data belongs to a user session.
Installing Application Insights in your application is straightforward, it includes these steps:
- Create an Application Insights service in the Azure portal
- Installing NuGet packages
- Enter instrumentation key in the
applicationinsights.config - Place JavaScript (copy from portal) in
<head>HTML
The JavaScript code that needs to be placed in the <head> section will load an external script on your page. By inspecting your HTML with for example Chrome developer tools you’ll find the following script.
<script src="https://az416426.vo.msecnd.net/scripts/a/ai.0.js"></script>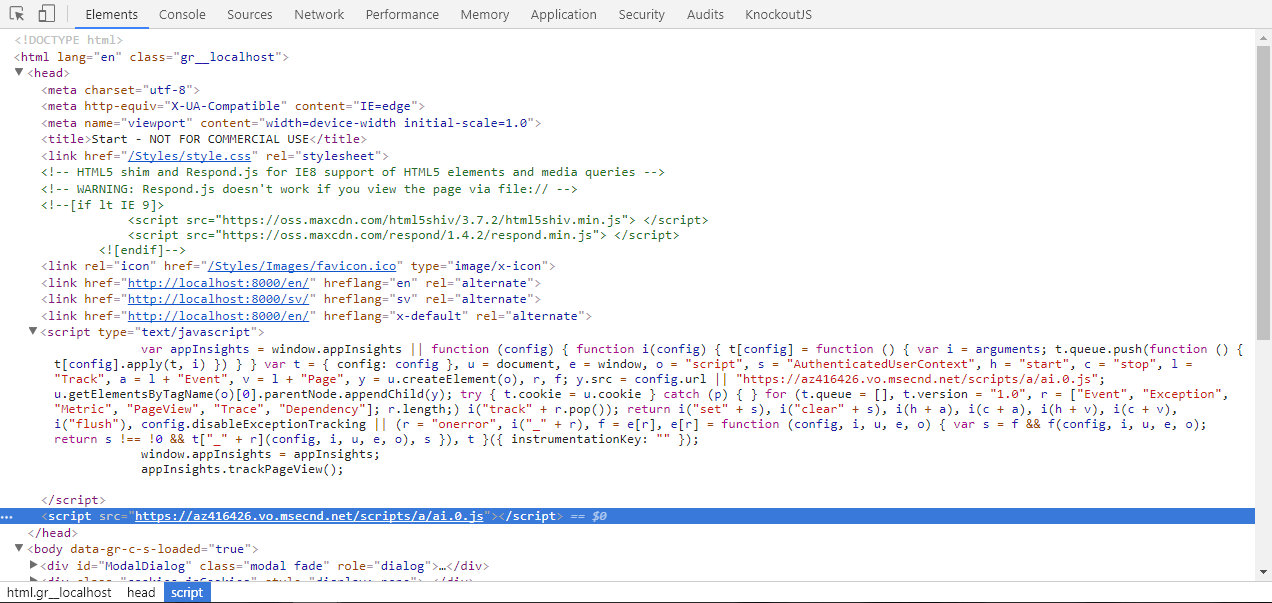
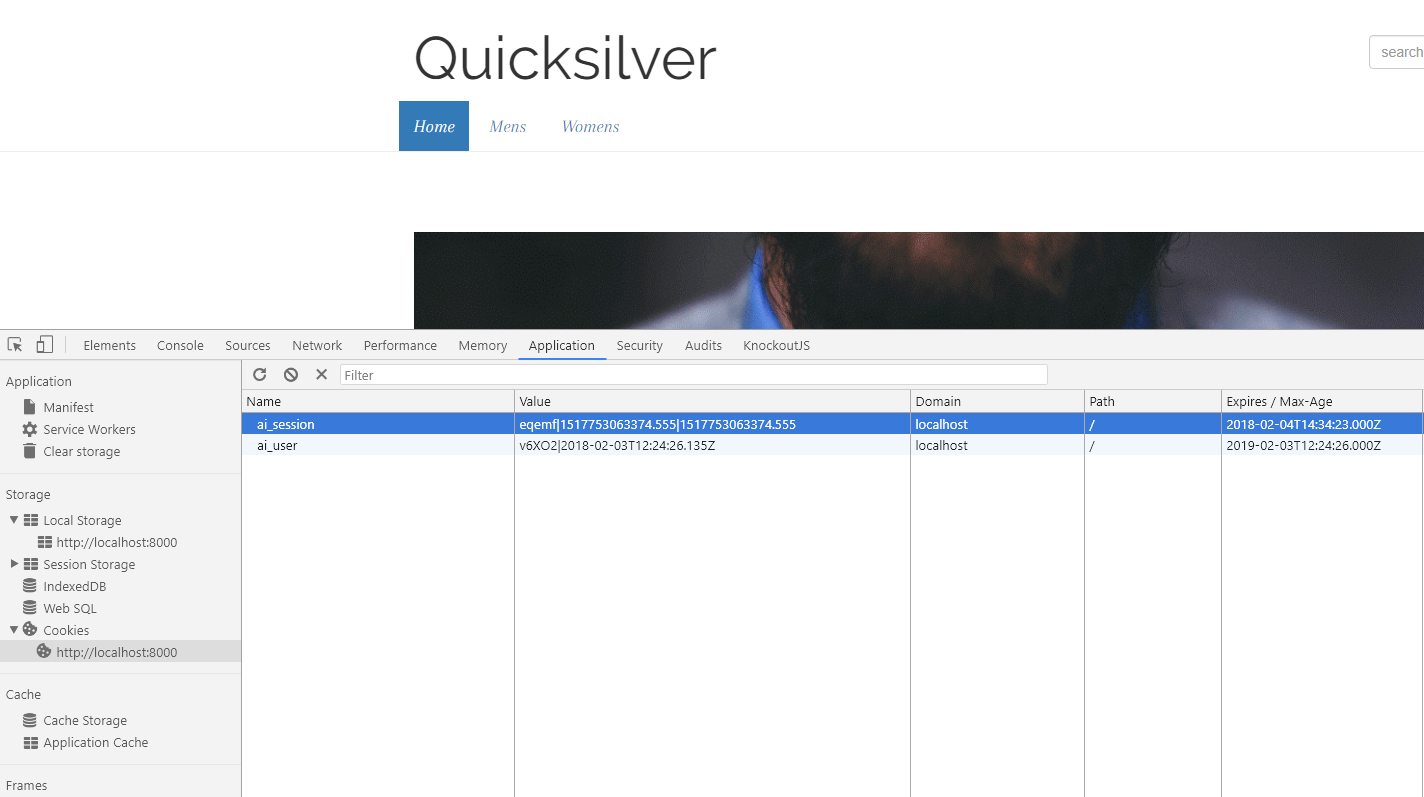
This script is open source and can be found on GitHub: https://github.com/Microsoft/ApplicationInsights-JS. As you probably know telemetry data is sent both client and server side. All telemetry data that is tracked client side will be sent to Application Insights by this script. In order to group telemetry data per user session, a cookie named ai_session is created. For each new user session, a unique value is generated and saved in the cookie. All telemetry data that is tracked and send to Azure is enriched with this generated value. Basically, this means that Application Insights can easily group all telemetry data based on this session value. This can be all kind of telemetry data, for example, when a user visits a page, a custom event is pushed, dependency calls, etc. The created cookie has a sliding expiration date of 30 minutes. The value of the cookie contains three different values separated by a pipe. 1Yq3O|1516899737023|1516900781881.57.
The first value contains the unique identifier, secondly the time when the cookie was created and lastly the renewal time which is being updated when new telemetry data is pushed. If 30 minutes or longer no telemetry data is tracked the cookie is cleared or overwritten with a new session id. In order to control or customize the default behavior, you can use the configuration settings,sessionRenewalMs, sessionExpirationMs. Application Insights can also identify returning users, I’ll come back to that later. The isFirst property which is a boolean, tells if it’s the first session of a user.
The portal of Application Insights lets you investigate telemetry data in several ways. One of the blades is called ‘Sessions’ and as the name suggests it let you investigate user sessions. This allows you to analyze individual user sessions. For example, you can see which pages a user visited and how the user interacted with different components on your website. The different filters allow you to discover popular user flows. For example, what did users do before a certain event or pageview and what did they do afterward. All can be useful information to optimize and improve your website.
The way Application Insights recognizes returning users is somehow similar like for collecting telemetry data for user sessions. The first time a new user is visiting your website a unique identifier is generated and stored in a cookie called ai_user. All telemetry data that is tracked for this user is enriched with this unique identifier. The user cookie expires in 365 days and never retires. The value of the cookie contains two values separated by a pipe: URHeT|2017-11-18T14:27:58.369Z.
The first value is the unique user id and the second value is the date time the cookie was created. In the EU the cookie law prevents websites to unasked create cookies that track user behavior. A cookie warning must be displayed and accepted by the visitor before cookies can be created. To prevent that cookies are created you can set the isCookieUseDisabled setting to true. Note, that setting this setting to true cookies are not created and the user id and session id is regenerated every time a page is refreshed or loaded.
Below an example of a page view telemetry data that is sent to Application Insights. In this JSON the session id, isFirst, and user id property is set.
{
    "time": "2018-01-25T17:41:35.707Z",
    "iKey": "INSTRUMENTATIONKEY",
    "name": "Microsoft.ApplicationInsights.INSTRUMENTATIONKEY.Pageview",
    "tags": {
      "ai.session.id": "CYCOF",
      "ai.session.isFirst": "true",
      "ai.device.id": "browser",
      "ai.device.type": "Browser",
      "ai.internal.sdkVersion": "javascript:1.0.14",
      "ai.user.id": "57kKw",
      "ai.operation.id": "oBGQn",
      "ai.operation.name": "\/"
    },
    "data": {
      "baseType": "PageviewData",
      "baseData": {
        "ver": 2,
        "name": "Start",
        "url": "http://localhost:8000/",
        "duration": "00:00:02.019"
      }
    }
  }
Telemetry data is stored in a buffer in order to send it efficiently to Azure
Since Application Insights is running in the cloud, all tracked telemetry data needs to be sent to Azure. Like you saw earlier in a code example this is being done in JSON format. By default, all kind of telemetry data is tracked automatically per request and this can be extended as well. So that means the number of requests to Azure can be quite a lot. To prevent a lot of requests to Azure, Application Insights is storing telemetry data in a buffer. This buffer is either stored in session storage or in a local variable, depends whether or not session storage is available. The setting enableSessionStorageBuffer can be set to false to use the ArraySendBuffer which is using local variables. Another option to use the ArraySendBuffer is to set the isStorageUseDisabled to true. The buffer can hold up to 2000 items or max 102400 bytes. The buffer is flushed when this max is reached or when the maxBatchInterval configuration (default: 15000ms) is elapsed. Flushing the buffer basically means that all telemetry data in the buffer is sent at once to Azure.
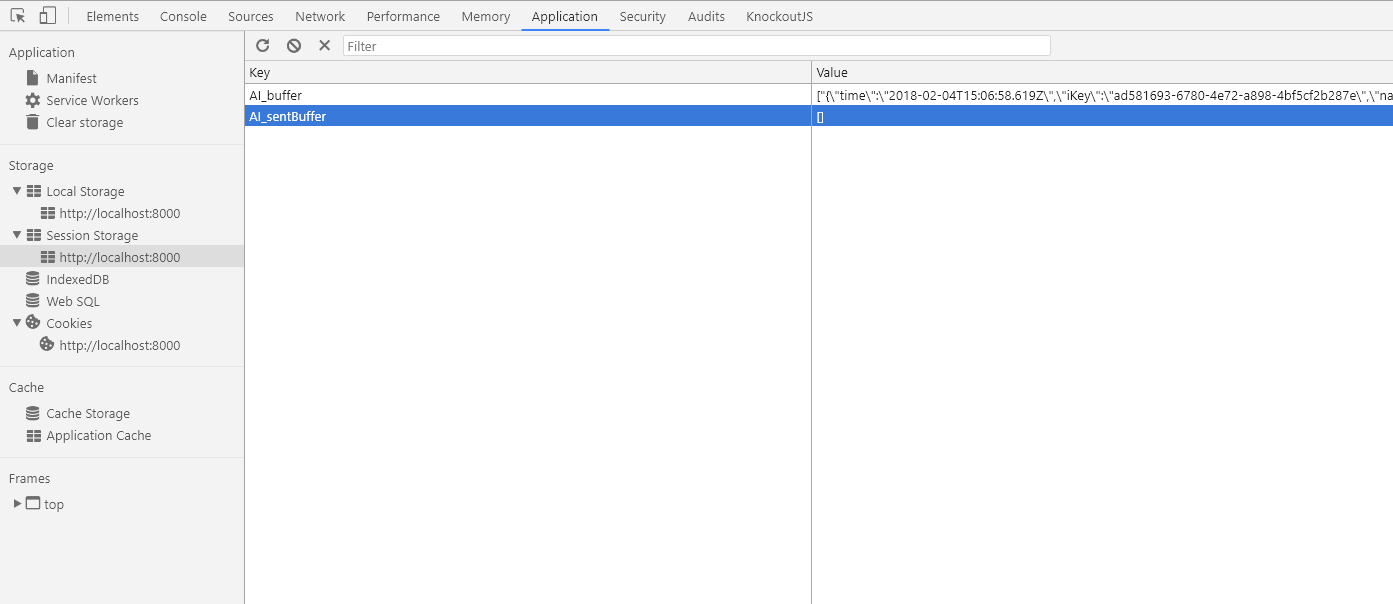
As you can see in the screenshot there is a second variable stored in the session storage called AI_sentbuffer. When the AI_buffer is flushed the items are copied to the AI_sentbuffer. The items in this variable are cleared when there is a successful response for sending the items to Azure. A retry policy is activated when there wasn’t a successful response.
There is a similar set up for tracking telemetry data server side. The InMemoryChannel is responsible for controlling the buffer. When the developer mode is enabled telemetry data is sent immediately to Azure without storing it first in the buffer. This developer mode is not available client-side. However, it’s possible to send telemetry data directly by setting the maxBatchSizeInBytes to 1 and maxBatchInterval to 1.
Data sampling reduce the amount of data sent to Azure and monthly costs
In order to reduce the amount of data that is collected by Application Insights and to reduce the monthly costs, data sampling can be enabled. As a matter of fact, this is enabled by default. Application Insights provides three different types of data sampling.
Adaptive sampling
Adaptive sampling reduces the amount of telemetry data that is sent to Application Insights. This will prevent that you’ll not exceed the maximum rate for sending telemetry data. Adaptive sampling is not active when there is a low volume of telemetry data. Basically, means that adaptive sampling is only operative when your website is facing high-traffic. The sampling algorithm can be customized in the applicationinsights.config. For example, the MaxTelemetryItemsPerSecond defines the max number of telemetry items that are sent per second or ExcludeTypes defines which type should be ignored by the AdaptiveSamplingTelemetryProcessor. At the moment of writing adaptive sampling can only be used server-side.
<TelemetryProcessors>
		<Add Type="Microsoft.ApplicationInsights.Extensibility.PerfCounterCollector.QuickPulse.QuickPulseTelemetryProcessor, Microsoft.AI.PerfCounterCollector"/>
		<Add Type="Microsoft.ApplicationInsights.Extensibility.AutocollectedMetricsExtractor, Microsoft.ApplicationInsights"/>
		<Add Type="Microsoft.ApplicationInsights.WindowsServer.TelemetryChannel.AdaptiveSamplingTelemetryProcessor, Microsoft.AI.ServerTelemetryChannel">
			<MaxTelemetryItemsPerSecond>5</MaxTelemetryItemsPerSecond>
			<ExcludedTypes>Event</ExcludedTypes>
		</Add>
	</TelemetryProcessors>
Fixed-rate sampling
This type of sampling will also reduce the amount of telemetry data that is sent to Azure. In comparison with adaptive sampling, fixed-rate sampling is always active so it will always sample telemetry data. The sampling percentage can be configured in the applicationinsights.config. Important to note is that related telemetry item (items tracked in the same operation and for a user session) are not affected. So that means when you analyze a page view in the portal you’ll always see the related tracked telemetry items like for example custom events. This is applicable for both adaptive and fixed-rate sampling. Fixed-rate sampling can be used both server-side and client-side.
In order to enable fixed-rate sampling server-side, remove the AdaptiveSamplingTelemetryProcessor from the applicationinsights.config file. Add the SamplingTelemetryProcessor and define a sampling percentage, like in the code sample.
<TelemetryProcessors>
		<Add Type="Microsoft.ApplicationInsights.Extensibility.PerfCounterCollector.QuickPulse.QuickPulseTelemetryProcessor, Microsoft.AI.PerfCounterCollector"/>
		<Add Type="Microsoft.ApplicationInsights.Extensibility.AutocollectedMetricsExtractor, Microsoft.ApplicationInsights"/>
    <Add Type="Microsoft.ApplicationInsights.WindowsServer.TelemetryChannel.SamplingTelemetryProcessor, Microsoft.AI.ServerTelemetryChannel">
      <SamplingPercentage>10</SamplingPercentage>
    </Add>
</TelemetryProcessors>
Use the samplingPercentage setting to set the sampling percentage client-side.
<script type="text/javascript">
            var appInsights = window.appInsights || function (config) { function i(config) { t[config] = function () { var i = arguments; t.queue.push(function () { t[config].apply(t, i) }) } } var t = { config: config }, u = document, e = window, o = "script", s = "AuthenticatedUserContext", h = "start", c = "stop", l = "Track", a = l + "Event", v = l + "Page", y = u.createElement(o), r, f; y.src = config.url || "https://az416426.vo.msecnd.net/scripts/a/ai.0.js"; u.getElementsByTagName(o)[0].parentNode.appendChild(y); try { t.cookie = u.cookie } catch (p) { } for (t.queue = [], t.version = "1.0", r = ["Event", "Exception", "Metric", "PageView", "Trace", "Dependency"]; r.length;) i("track" + r.pop()); return i("set" + s), i("clear" + s), i(h + a), i(c + a), i(h + v), i(c + v), i("flush"), config.disableExceptionTracking || (r = "onerror", i("_" + r), f = e[r], e[r] = function (config, i, u, e, o) { var s = f && f(config, i, u, e, o); return s !== !0 && t["_" + r](config, i, u, e, o), s }), t }({ instrumentationKey: "", samplingPercentage: 80 });
            window.appInsights = appInsights;
            appInsights.trackPageView();
</script>
Under the hood, telemetry data is sampled based on the generated user id. Let’s take a closer look how this is done client side. Like I already explained for each user (anonymous and authenticated) a unique user id is generated. This is saved in a cookie named ai_user. To determine if telemetry data should be sampled the user id is used. The method hashCodeGeneragor.getHashCodeScore will calculate a sample score based on the user id. If the score is higher than the configured sample rate the telemetry data will not be sent to Azure.
Below a demo of how this actually works. For every page refresh, I first display the generated user id which is stored in a cookie. Next, I get a hash score based on the user id and if the score is higher than the samplingPercentage telemetry data is sampled. By removing the cookie, a new user id is generated and I repeat the steps until the score condition is false which means that telemetry is sampled.
Ingestion sampling
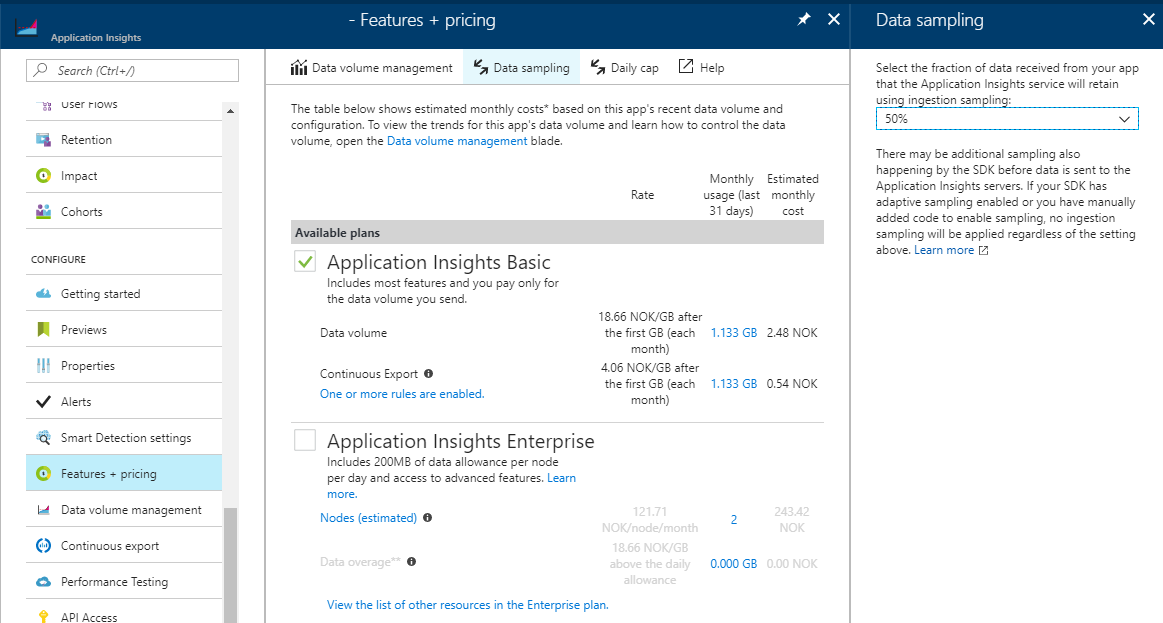
Ingestion sampling doesn’t affect the amount of data that is sent to Azure. All tracked telemetry data is sent to Azure. Ingestion sampling takes place in Azure, simply not all received telemetry data is processed. This type of sampling can only be enabled in the Azure portal and is especially useful when you’re close to your monthly quota and don’t want to do a new production deployment. By default, ingestions sampling is disabled.
In some occasions, you might always want to see some specific events in the portal. So basically, you don’t want to sample these events. This can be accomplished by creating a new TelemetryClient and pass a customized TelemetryConfiguration . Just remove the sampling processors or customize in a way that telemetry data is not sampled like in the code sample.
            var configuration = TelemetryConfiguration.Active;
            configuration.TelemetryProcessorChainBuilder.UseSampling(100);
            configuration.TelemetryProcessorChainBuilder.UseAdaptiveSampling(excludedTypes: "Event");

            var customTelemetryClient = new TelemetryClient(configuration);

            customTelemetryClient.TrackEvent("Event 1");
Please leave a comment below, I would love to get feedback and hear about your ideas.
 Twitter
 LinkedIn
 GitHub