Solve production exceptions in no time with Application Insights Snapshots
Microsoft announced an exciting new feature of Application Insights that's gonna save developers a lot of time when solving production exceptions. This new feature was announced during Build 2017 and is called snapshots for Application Insights. Build 2017 is a Microsoft conference where always tons of new features for different products are announced. Microsoft is continuously improving their product Application Insights by adding new features on a regular basis. The previous big feature was the profiling capability which provides insights in hot paths in code when requests are executed. In this blog, I'll guide you through the new snapshots feature.
I earlier blogged about how you can use Application Insights for solving exceptions. It's sometimes a pain for developers to solve exceptions especially when there is a lack of information for production problems. End users or clients are sometimes a bit sloppy with providing information that's needed for a developer to understand why or what is causing exceptions. Normally this means the developer needs to spend extra time in first reproducing the problem and then solving it. In the blog I wrote a while ago I explained how Application Insights can help by solving exceptions. First by using the different search and filter capabilities to gather as much as data as possible. Secondly, how a specific user session can be analyzed which can help the developer to reproduce the exception locally. This is extremely helpful with production exceptions that only happen occasionally since these type of exceptions are difficult to trace. Lastly, I explained that you can push extra meta information to Application Insights that can help you understand or identify the cause. In this blog, I'll use the same example as in my previous blog so make sure you have read that blog first. I'll explain how snapshots provide all the data that you need to solve production exceptions fast and efficient.
What are snapshots?
Snapshots can be used when your application runs in Azure and Application Insights is enabled. Snapshots are taken when exceptions occur. It contains valuable information about the current state of your application when an exception occurred. That's not only the exception message and stack trace but also the state of all local variables at the location where the exception was thrown. Think of how easy it would be to reproduce an exception when you exactly know the values of all variables. A snapshot can be analyzed in two ways, either in the Azure portal or in Visual Studio. Of course, it's already extremely useful knowing all values of the variables but it's even better to do that directly in Visual Studio. What I mean is that you can debug a snapshot. It's like debugging your application locally and an exception is thrown. Pretty awesome if you ask me. In the next section, I'll explain how you can enable snapshots in your Visual Studio solution.
Configure snapshots in your Visual Studio solution
The snapshot feature can be enabled and configured directly in Visual Studio. The first step would be to install the Microsoft.ApplicationInsights.SnapshotCollector NuGet package. This package will collect all information from the current state of the application and create snapshots when exceptions are thrown. Snapshots can be investigated both in the Azure portal online and in Visual Studio. To be able to open a snapshot (.diagsession) in Visual Studio you need to install the Microsoft Snapshot Debugger extension. I'll discuss later what you can do with a snapshot in Visual Studio. Lastly, snapshots can be configured in the applicationinsights.config. The table below shows an overview plus explanation of all possible configurations.
| IsEnabled | Enable or disable the snapshots feature. |
| IsEnabledInDeveloperMode | Enable or disable the snapshots feature while your application is in developer mode. |
| ThresholdForSnapshotting | How many times an exception needs to occur within an interval (configuration 'ProblemCounterResetInterval') before a snapshot is taken. |
| MaximumSnapshotsRequired | Maximum number of snapshots that will be created for a specific exception within 24 hours. |
| MaximumCollectionPlanSize | Number of exceptions that can be monitored at any time. Keep in mind that the package keeps in memory how often an exception is thrown and whether or not a snapshot needs to be created. |
| ProblemCounterResetInterval | The package keeps in memory how often a specific exception occurs. This configuration will reset these counters at an interval. |
| SnapshotPerMinuteLimit | How many snapshots max can be taken every minute. |
| SnapshotsPerDayLimit | How many snapshots max can be taken every day. |
Note in order to make proper snapshot you'll need to publish the .pdb files to your web app. Also, make sure that optimize build is not enabled since this will affect the availability of the local variables. Microsoft says that in future releases this will be fixed.
Web application exception
What I already mentioned in the introduction is that I'm using the same demo application that I used in this blog. In short, visitors can do a registration in the demo application. The registration form changes based on the category selection that can be done on a different page. When a visitor selects the category 'car' and the registration form is submitted an exception occurs. This doesn't happen when the visitor selects a different category and submits the registration form. Since this exception only happens occasionally it can be hard to reproduce. In the previous blog, I explained that you can investigate the telemetry data for specific user sessions. That will reveal the information that's entered by the visitor and triggered the exception. In this blog, I'll use snapshots to solve the same exception. Below an animation of the problem.
Analyze a snapshot in the Azure portal
Snapshots are available in the Azure portal. As I explained earlier you've full control how many times and when snapshot are taken and stored. You can find the taken snapshot at the related exception. There are different ways for finding exceptions in the portal. The search blade provides all the searching and filtering features that you need. When the whole request is failing you can also use the Failures blade which can be opened in the left navigation. This is what I did since the register request returns a 500 server error.
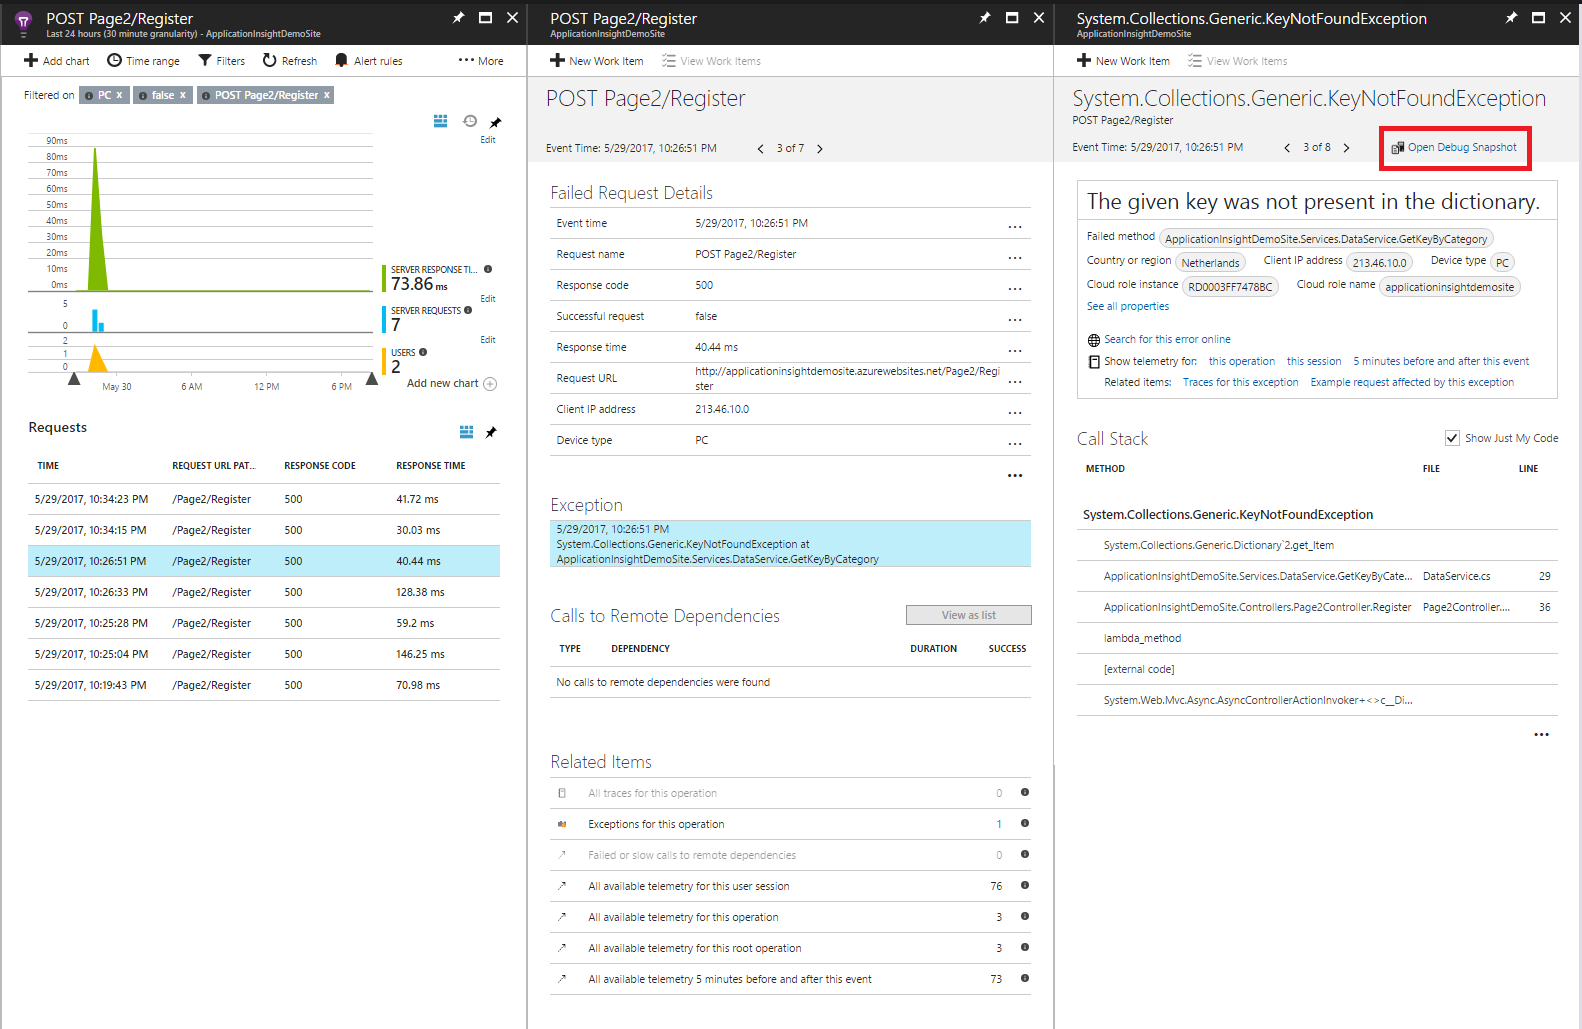
In the screenshot (click on the image for a larger image), you can see that I found an exception in the Failures blade. Clicking on the request opens a new blade with information about that request. This blade also contains the exception that occurred. More information about this exception can be opened by selecting it. The type of exception is a KeyNotFoundException. For this exception, a snapshot is taken as you can see in the top right corner. Again you can configure how many times an exception need to occur before a snapshot is taken. I've configured that this should be done for every exception. Don't worry you don't need to open every exception in the portal for checking if a snapshot was taken. Fortunately, fields about the taken snapshots are added to an exception. That makes it easy to filter on all exceptions with a snapshot. You can start analyzing the snapshot by clicking on the 'Open Debug Snapshot link'.
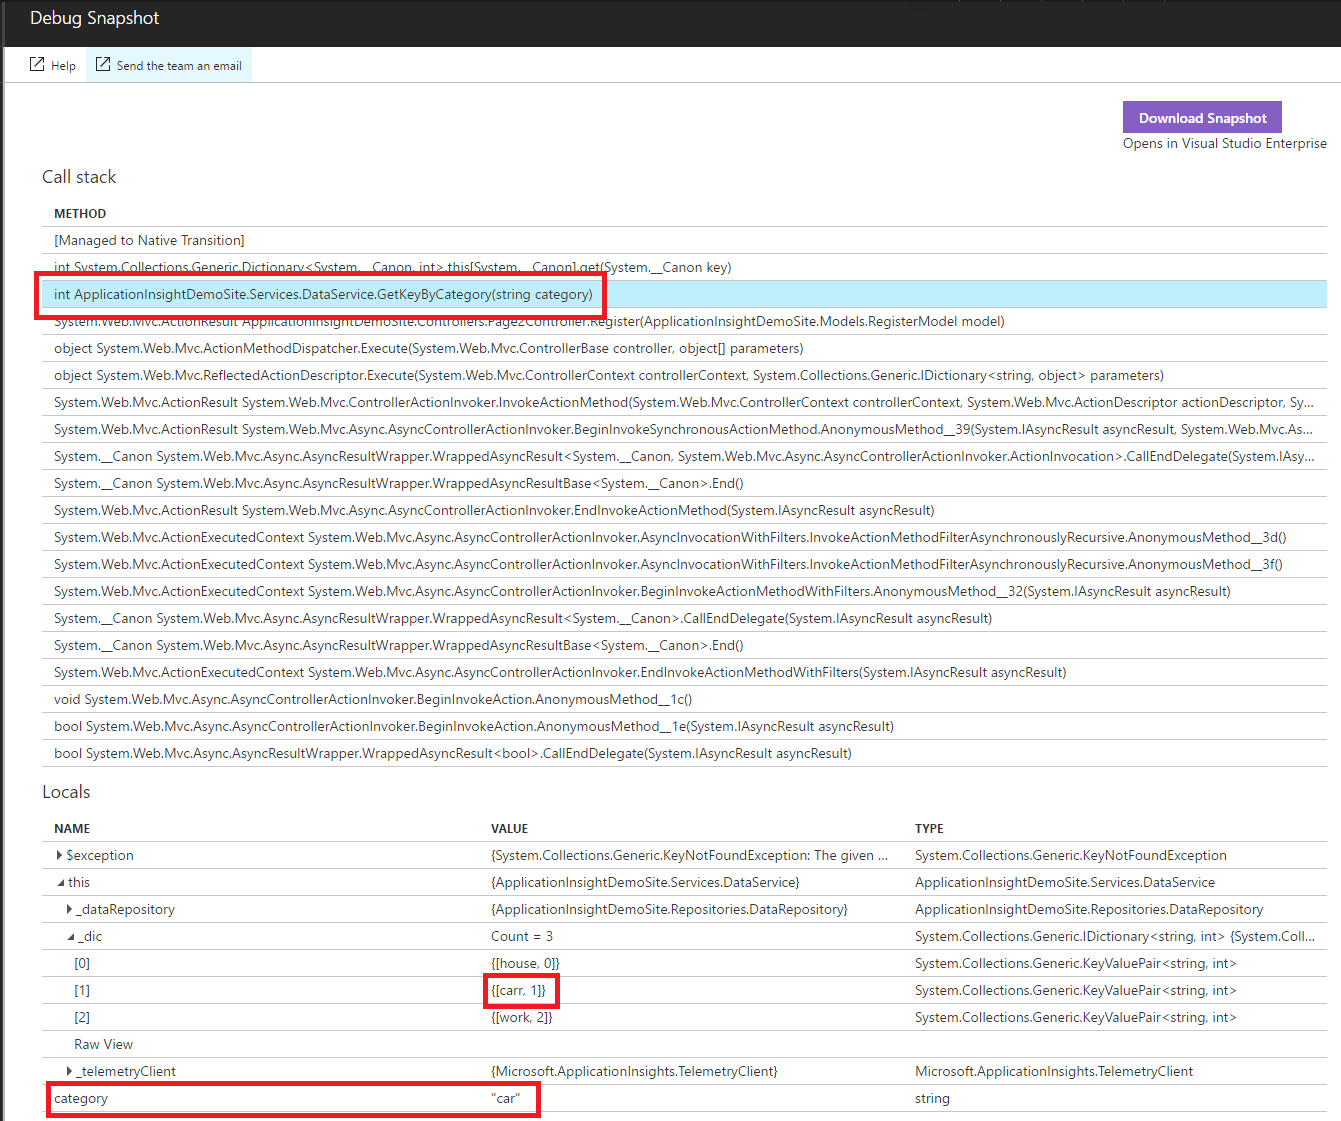
The blade where a snapshot can be analyzed contains two sections the call stack and the locals. The stack trace is self-explaining, it shows where the exception occurred and the previous code lines. In this overview, we can select every row to inspect the local variables which are shown underneath the call stack. Correct me when I'm wrong but isn't this exactly what we developers want when investigating a production exception? As you can see in the screenshot below (again clicking on the image for a larger image) I've selected the row that's causing the exception. The locals overview provides me information about the state of the local variables at the moment the snapshot was taken. What happens is that I'm trying to get an item from the dictionary by a key that's not present. The overview shows all items in the _dic dictionary and also the state of the category variable (which I'm using to getting an item from the dictionary). By looking at the values of the variables you can see that there is a mismatch. Apparently, I've made a typo in the dictionary. I defined 'carr' instead of 'car'.
Note it's possible to select every code line in the call stack and investigate the local variables.
Debug a snapshot in Visual Studio
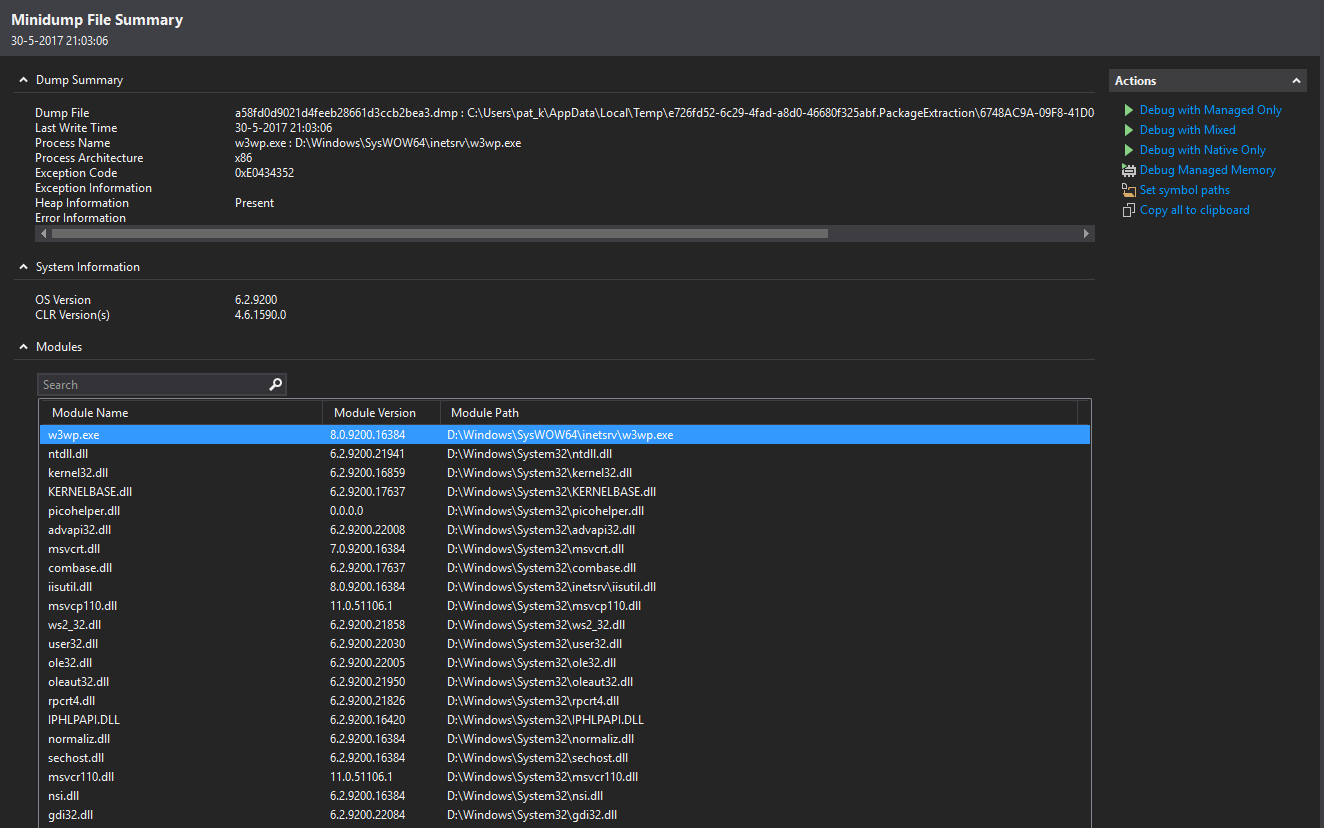
In the previous screenshot, you could see in the top right corner a link to download the snapshot and open it in Visual Studio. The file (.diagsession) is approximately 100 MB but varies in size, in my case, it's 132 MB. When opening the file in Visual Studio it provides some information about the dump file, system information, and modules. In the top right corner, we can find action links. The snapshot can be debugged by clicking on of the debug action links.
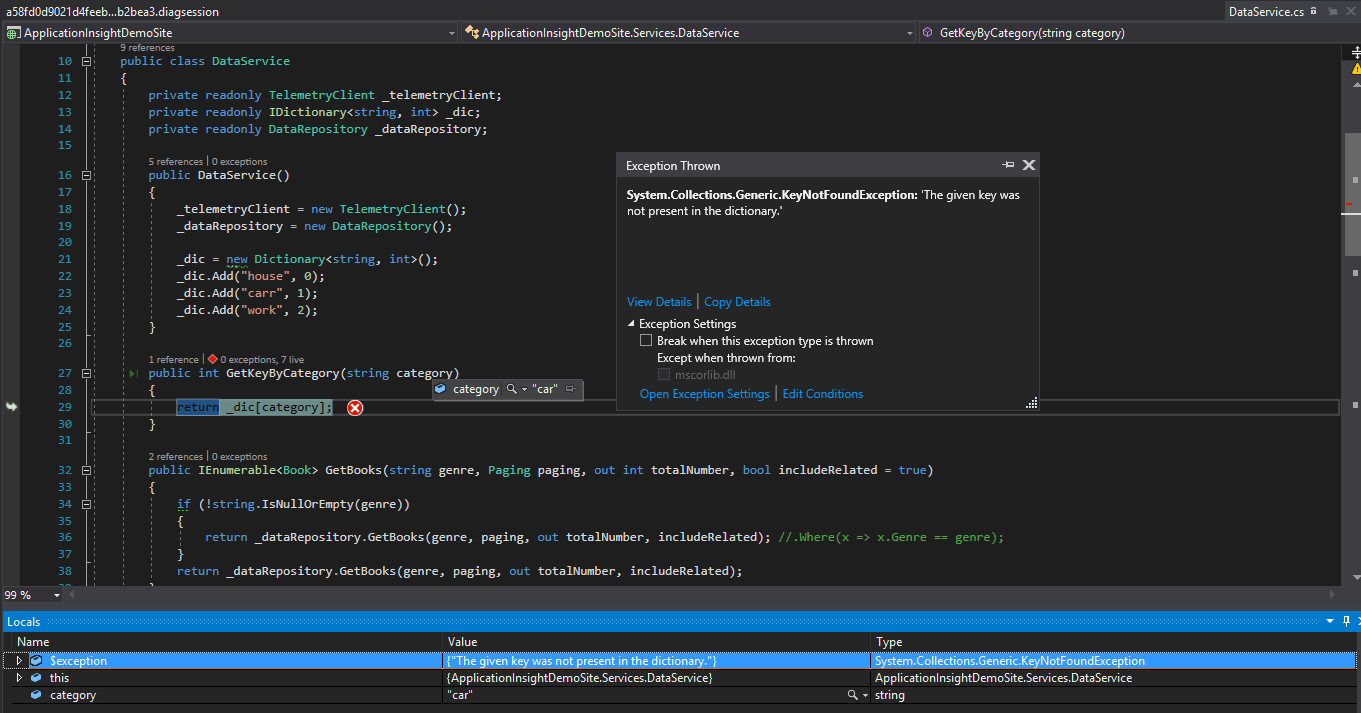
Debugging a snapshot feels like as you're debugging your application locally. It basically provides the same information as in the Azure portal but it feels so more naturally in Visual Studio as a developer. In Visual Studio we can easily navigate between classes and methods and that will probably make it easier to find the cause of an exception. As you can see in the screenshot below, the exception occurs when I'm trying to get an item from the _dic dictionary by the category variable which is passed as a parameter to the GetKeyByCategory method. The value of the category variable will be displayed when hovering it. This information is also available in the Locals window at the bottom of the screen. Note it's not possible to use the step over/into/out functionality since that is not supported for debugging dump files.
As mentioned earlier this feature is still in preview mode so don't be surprised when you find things that don't work properly. In my previous blog, about solving exceptions with Application Insights I explained how you can find telemetry data for specific user sessions and how that can help you solve exceptions. The snapshot feature takes solving production exceptions to the next level. Having access to all local variables at the moment an exception occurred in production is extremely useful. Microsoft already announced additional functionality that will be available mid-summer. This update will make it possible to attach Visual Studio to an application in Azure in a special debugging mode. In this mode, it's possible to set a breakpoint that will trigger Visual Studio to collect snapshots for that specific point in the code. Again these snapshots will provide information about the local variables.
 Twitter
 LinkedIn
 GitHub