Use results from a load/performance test and Application Insights to solve performance problems
By load testing your application you can prevent performance problems when the application is in production. Azure provides a feature to set up a performance test, which is still in preview mode. This can be either a very basic load test by testing only one URL or a multi-step test. In this blog, I want to take my time to explain what the benefits are for load testing your application, how you can set up and run a load test and how you can use Application Insights to investigate the load test results. Take a moment to read one of my previous blogs about Application Insights if you're interested.
Why should I load test my application?
There are many benefits for load testing your application. While developing your application you might think that the performance is quite ok. Also, the test or acceptance environment could be promising. The customer is satisfied with the performance, so everything seems to be ready for the final production release. After deploying to production performance problem occurs. Seems impossible, but it's not. Even when the test or acceptance environment is very well tested by the customer you can't tell what will happen when your application is exposed to an enormous load. Problems might occur that you didn't expect. Load testing your application before going to production will prevent these problems or surprises. Some developers might think it's a time-consuming operation for setting up or running a load test. This is however not the case. Actually, it's quite easy to set up. Nowadays it's even possible to set up a simple performance test in Azure, will explain this later in this blog. I'll explain how you can set up a load test on your local machine in Visual Studio and how you can do something similar in Azure. Also, I'll explain how you can use Application Insights to investigate the performance test results. I've created a demo application that I will use for a load test.
Bookstore demo site
For this blog, I've created an example site which includes two important pages that we want to test. Firstly, visitors are able to search for books on the search page. By default, all books are displayed in the overview. On the left side of the screen, the visitor can select a genre to filter on the available books. The product detail page can be opened by clicking on a book in the overview. This page shows all detail information of the book, related books with the same genre and a button to pre-order the book. The pre-order page contains a simple form where visitors needs to enter their personal information.
You might have notice that this simple demo site is based on the MVC template which can be used when creating a web application in Visual Studio. All books are stored in an XML file. Data that's entered in the pre-order form is saved in an XML file on the filesystem. Application Insights is already installed on this site. Read my blog about tracking telemetry data to learn how you can enable and configure Application Insights. The site is deployed to Azure web apps.
Below an animation of the user flow.
In the animation, we see the following user flow:
- Visitor opens the home page
- Clicks on the 'Books' menu item which opens the book overview page
- Filter is selected on the right side and overview is updated
- Clicks on a book which opens the book detail page
- Pre-order button is clicked
- Visitor enters personal information and submit the form
- Confirmation page is opened
At first, the performance looks quite ok, it's not very fast but acceptable though. Let's create a web test based on these steps in Visual Studio.
Create a web test in Visual Studio
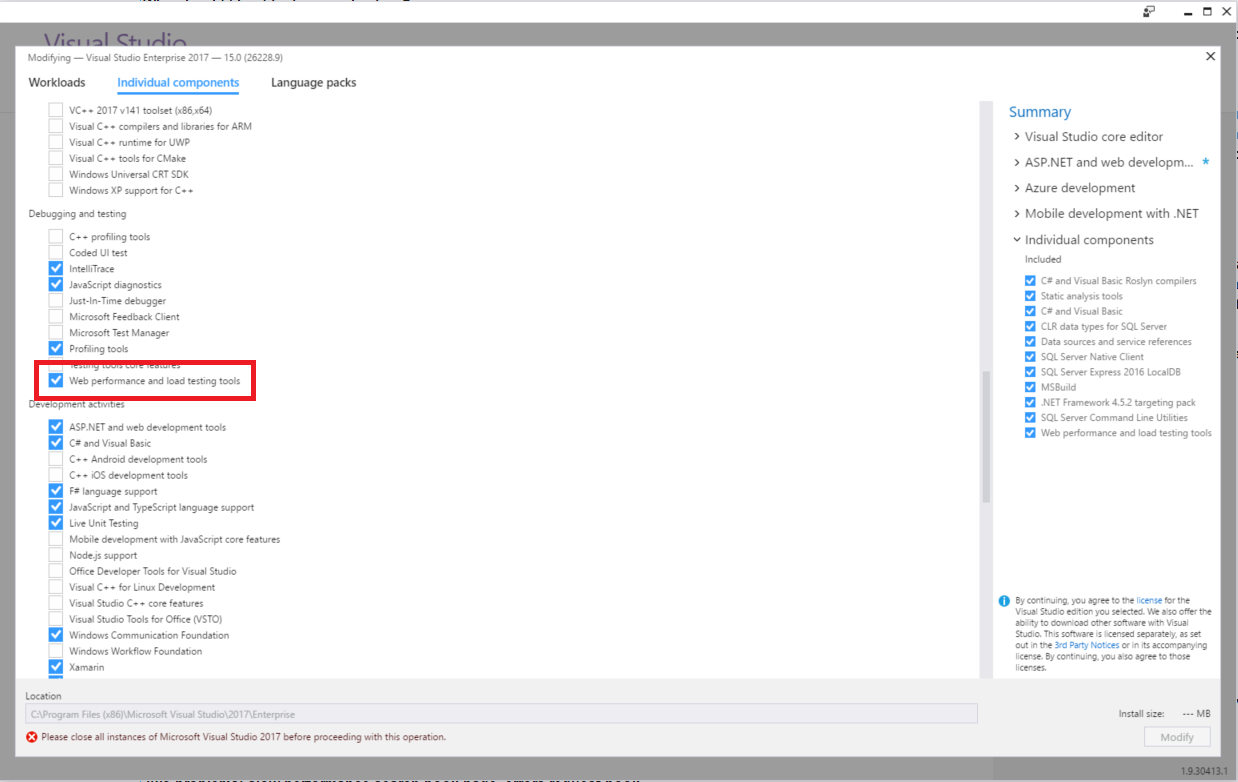
Before we can create a web test we need to create a new project based on the 'Web Performance and Load Test project'. When you're running Visual Studio 2017 you need to enable this template during installation. You can also do this after installation. Just open the Visual Studio Installer, modify the current installation and make sure that 'Web performance and load testing tools' is enabled. After installation, you're able to select the performance and load test project. Add a Web Performance Test to the project. You'll immediately notice that the browser is opened. We can now execute the steps what I described earlier, this will be recorded by Visual Studio. Press the 'Stop' button to stop recording and go back to Visual Studio. Note, if the Web Test Recorder does not appear follow these steps. In Visual Studio we should see all requests, like below.
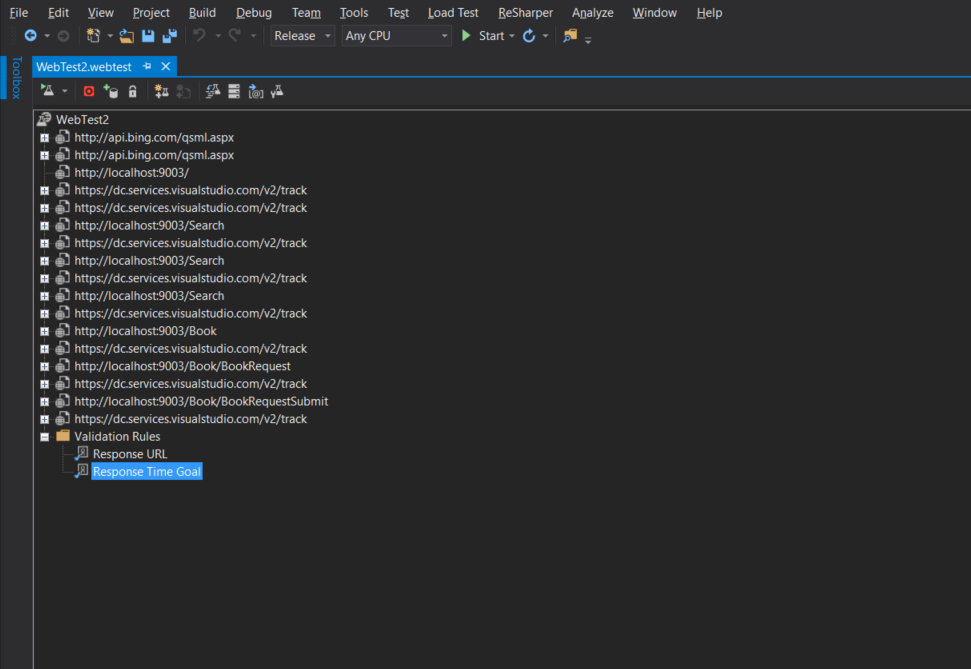
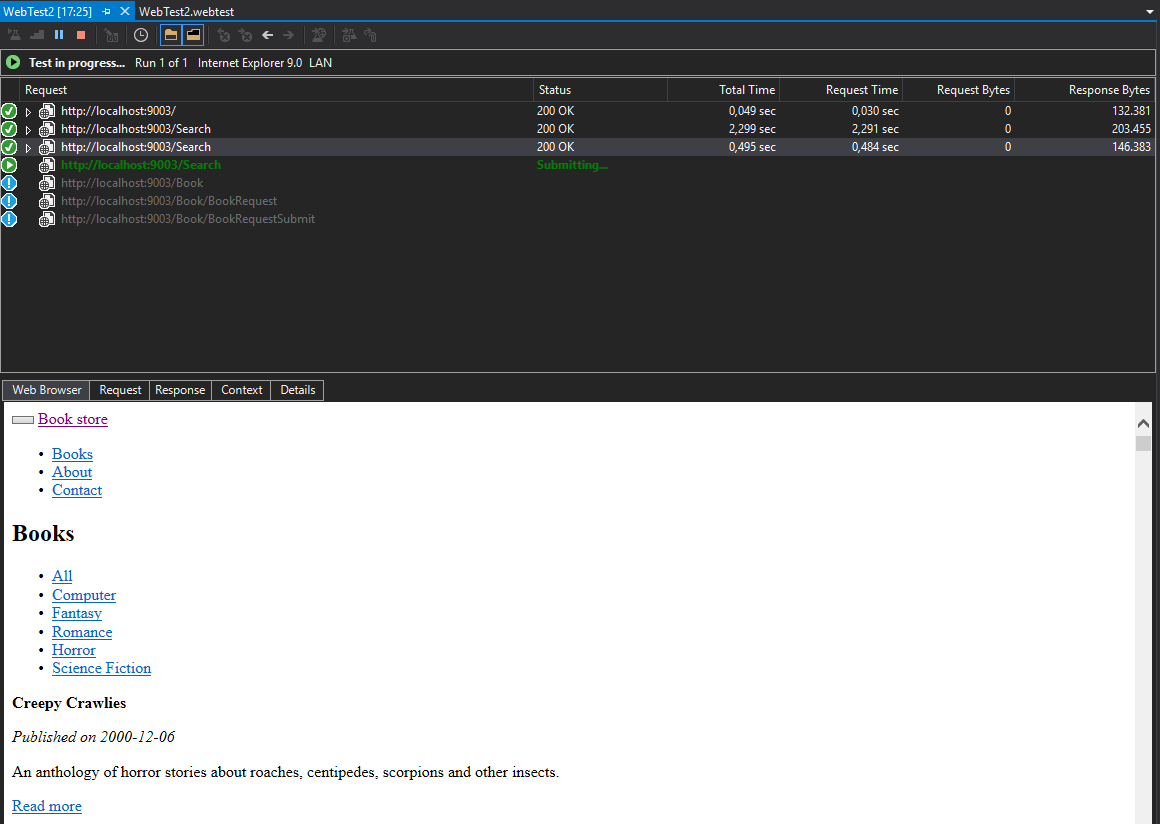
What you may notice are the requests to api.bing.com. Could happen that the recording contains some unnecessary requests. These can be simply deleted by selecting a request, right click and click delete. Another thing that stands out are the track requests to dc.services.visualstudio.com. These are executed by Application Insights to track telemetry data. We can also delete these requests from the web test since the track requests are triggered anyway by browsing to one of the page requests. We can run the test by clicking on the run button in the left top corner. The test should run successfully.
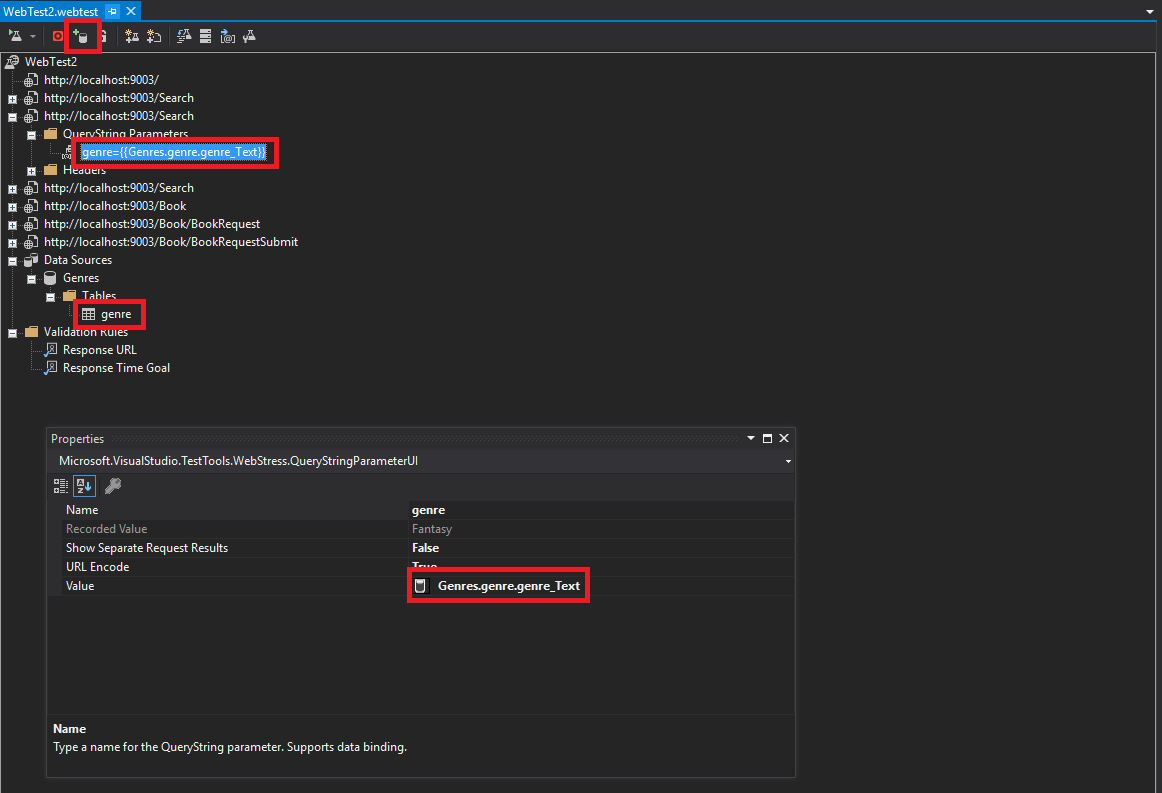
In the book overview page, the visitor can select a genre to filter the books. This is also what I did while recording the web test. If we look at the requests in the web test we can find three requests to the /Search URL. If we collapse the second and third request we can see that it contains a query string parameter. When we run the load test these query string parameters are used. We can also define a data source to randomize these parameters.
Use a data source to randomize query string parameters
The top bar contains a button called 'Add Data Source'. Clicking this button opens a dialog where we can select different data source types, database, CSV or an XML file. I've added a simple XML to the project containing all book genres. I'll add that XML file as a data source to the web test. A data source can one or more tables. I've only one table called genre. By selecting the genre table we can configure the access method. This configuration indicates what will happen when an item from the data source is retrieved. In our case, we would like to use a random item from the table. By selecting the query string parameter of the search request we can use an item from the data source/table instead of a hardcoded value. The Value property contains a drop down where we can select a data source -> table. Now every time this requests is done in our load test a random genre will be used. Note, don't forget to set the URL Encode property to true otherwise, a request with a query string containing a space will return a 400 bad request.
Run load test in Visual Studio
We can create and run load tests directly in Visual Studio. Since last year it's also possible to run performance tests in Azure, will explain this new feature in the next section. A new load test in Visual Studio can be created by right-clicking the 'Web Performance and Load Test' project and add new 'Load Test'. Immediately a new window is opened where we can configure the newly created load test. First, we can define if we would to run the load test on-premise (local machine) or in the cloud. When running the load test in Azure you'll need a Visual Studio Team Services (VSTS). You can create a free account, but it will be limited to 20,000 virtual user minutes every Month. Should be enough to play around. I will not go into detail regarding the other configurations, bu these are the configurations I used for the load test example.
- On-premise
- Run duration: 2 minutes
-
Constant user load
- 25 users
- Based on the total number of tests
- Network type: LAN
- Browser: Internet Explorer 9.0
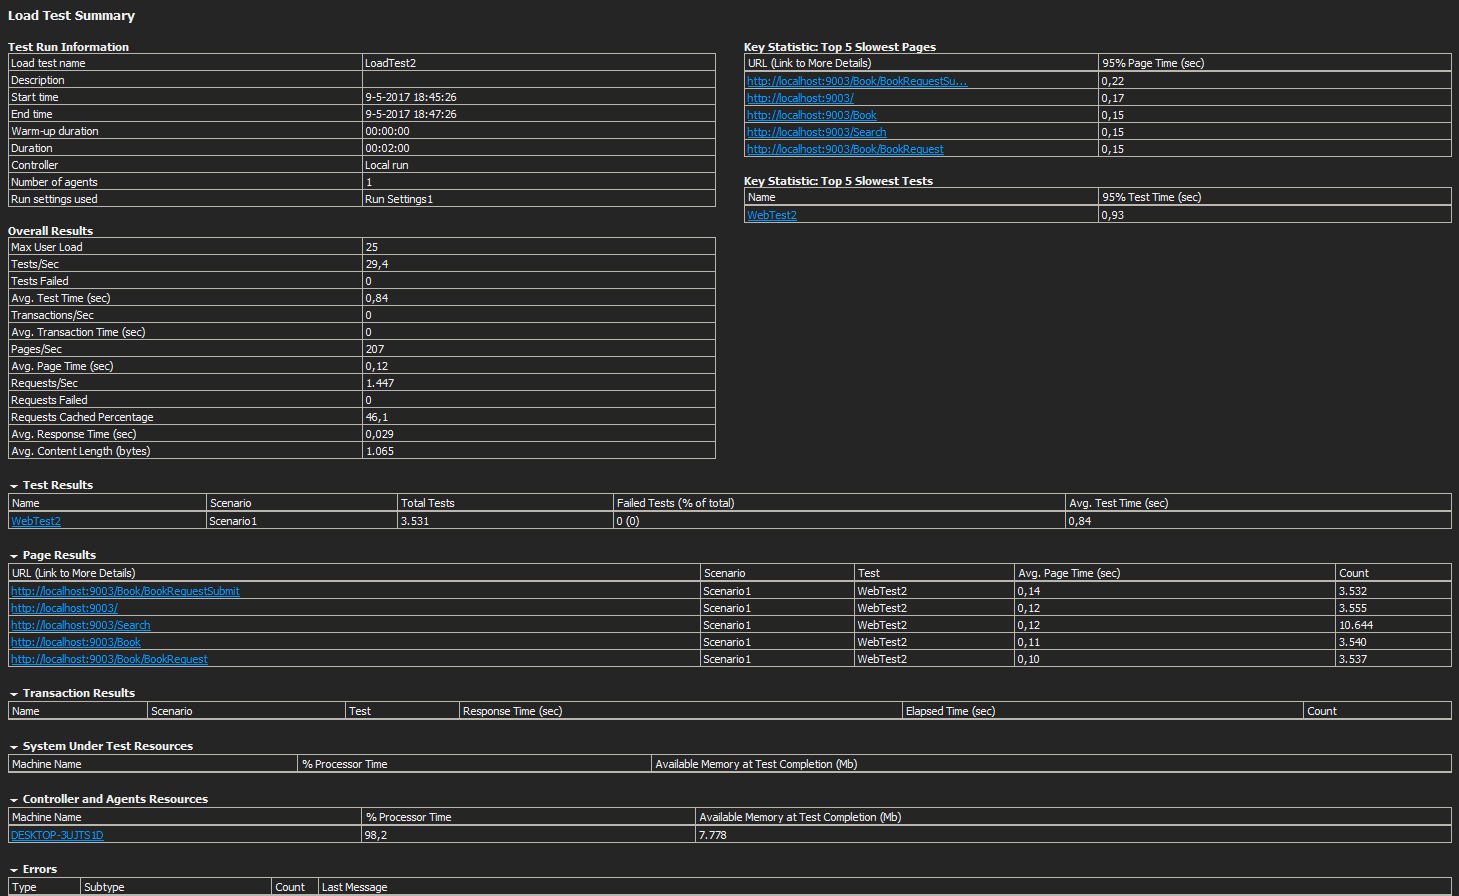
The above configurations is a very simple load test with a constant load of 25 users for 2 minutes. You could also configure a step load, where for instance you start with 1 user and increase that number every 10 seconds with 10 users. The following image shows the results of the load test.
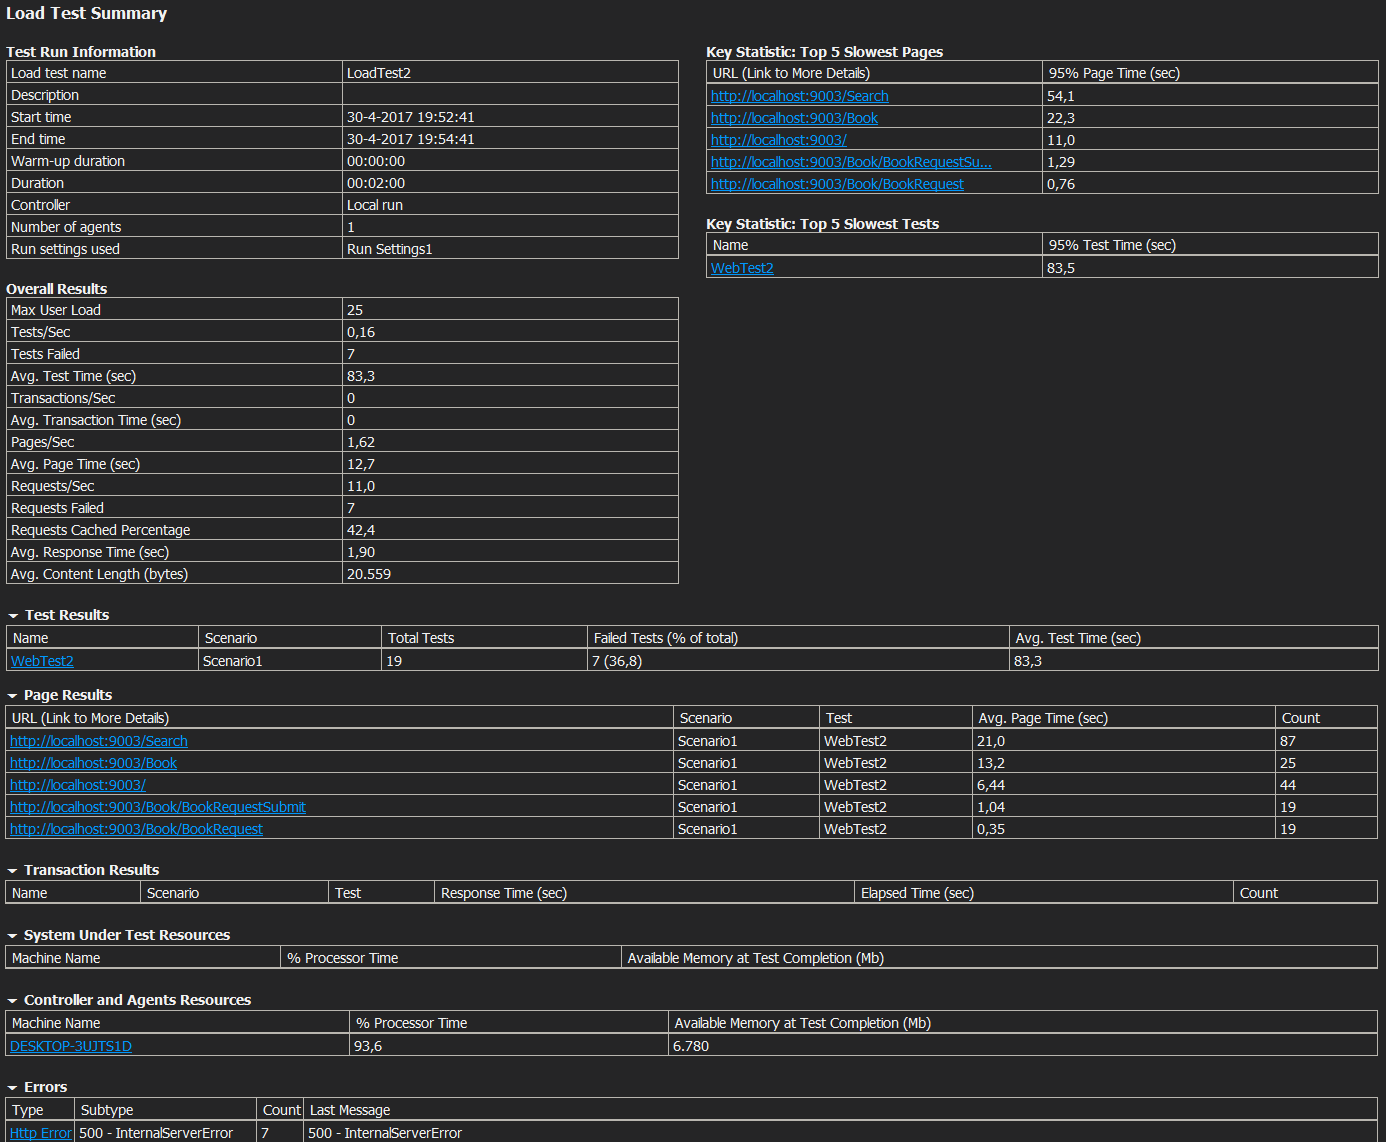
The test results provide useful information about the demo application. The Overall Results section provides a good summary of the load test. What stand out is the number of failed requests. Apparently, 7 requests are failing when the application is under a big user load. The Page Results section displays the average response time per request. The search page is not doing well with an average response time of 21 seconds. If we look down, even more, we can see the Errors section. 7 internal server errors were thrown while running the load test. A new window is open when we click on the errors link. Here we can find a list of all thrown error and it looks like errors are thrown when virtual users are pre-ordering a book (BookRequestSubmit). We can even select an error and go to the specific web test results that belong to this error (failed request). Now we can have a look at the response message for the failing BookRequestSubmit request.
"The process cannot access the file '\Data\requests.txt' because it is being used by another process."
So everything went fine while running a single web test, but when the application is under heavy load apparently resources are not cleared/closed.
The outcome of the test result indicates that there are two problems with the application that we need to solve:
- The performance of the search page is really bad. So is the performance of the other pages as well.
- Internal server errors are thrown when books are pre-ordered.
Before we solve the problems, I'll first explain how you can set up a performance test in Azure with the same created web test.
Run performance test in Azure (preview)
The performance test feature in Azure still contains the public preview label. This feature is around since 2015. Basically, what we can do is running a simple performance test based either on one URL or on a web test. I would like to execute the same web test that I've created in Visual Studio for running the on-premise load test. Currently, data sources for web tests are not supported in Azure. I've recorded another web test with the same steps but based on the demo application in (web app) Azure. Note that for this web test I'm not using a data source since this is not supported. Basically, the new web test contains the same request only the domain is different since it's using the web app in Azure. Of course, the web test in Azure would never work when all request were pointing to my local machine.
To create a performance test in Azure, we can simply browse to the web app and by clicking 'Performance test' under the development tools menu. The following configurations can be set.
| Test type | The test can be based either on a single or multiple URL's (web test). |
| Name | Name of the test. |
| Location | Choose one of the different regions in the world. |
| User load | Number of virtual users. The free service plan is limited to max 40 users. |
| Duration | Duration of the test. The free service plan is limited to max 1 minute. |
Note, that you will need a VSTS account for creating/running a performance test.
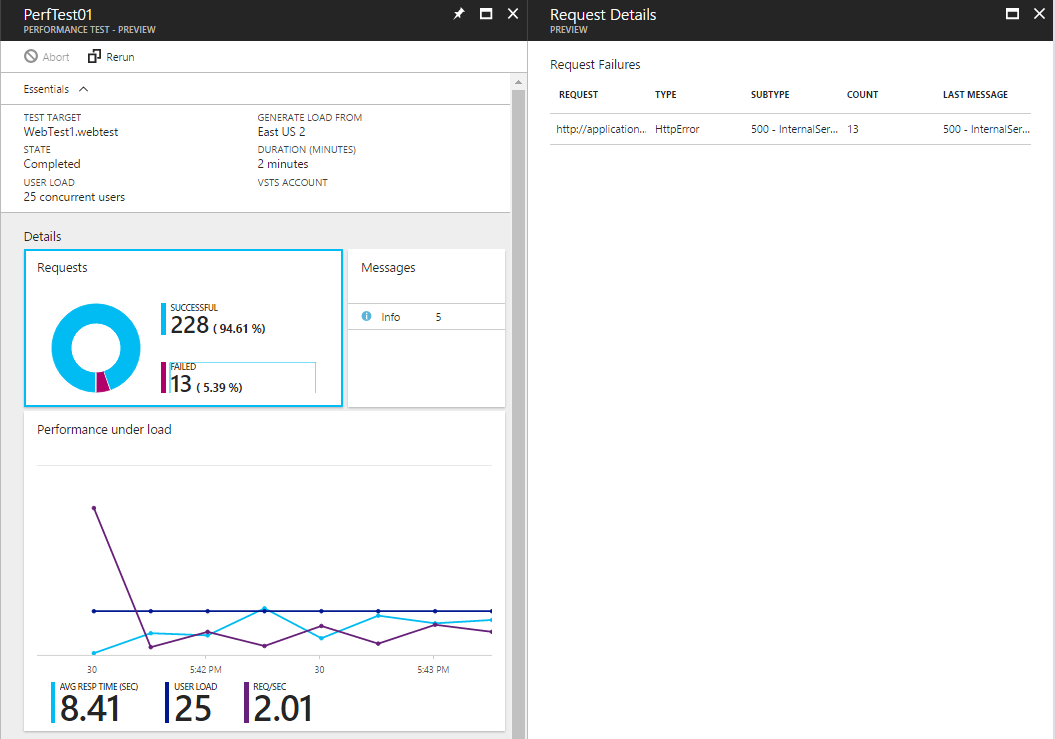
The advantage of the performance test in Azure is that it doesn't contain a lot effort to set up. Especially, when testing only a single URL. You'll be ready in a few seconds. The only downside is the number of information available of the test results. Fortunately, we can use Application Insights to investigate the results in detail. This will provide all the data we need. Let's start with the performance test results. We immediately see the number of failed requests. If we click on that number we find out that the BookRequestSubmit request is failing. Which corresponds to the load test results in Visual Studio. The test results tell us that the average response time is 8.49 seconds. The graph shows snapshots taken every 15 seconds. This tells us the progress of the load test. When we scroll down, we'll find the web app usage. So this provides information about the CPU time and memory usage. Since Application Insights is enabled in the web app all requests are tracked. Let's continue investigating that data.
Note, that a performance test will have effect on the CPU time (usage of the web app). So when you're running a performance test multiple times and your web app uses the free pricing plan your web app may be stopped when reaching the usage limit. You'll notice the same problem with the pricing plan of Application Insights.
Investigate Application Insights for results
A recorded web test can contain multiple requests. These are ordinary requests what I explained earlier. Application Insights is enabled in the demo application. This means that telemetry data is tracked whenever a performance test In Azure is executed.
It's important to keep in account that Application Insights samples the data. Well, you can configure how much (or maybe not at all) of the data you would like to sample of course. There are also different ways to sample data. For example, you could limit the amount of data that is sent from you web application to Application Insights. You could also handle this in Azure, that means the data is sent to Azure but it's not stored.
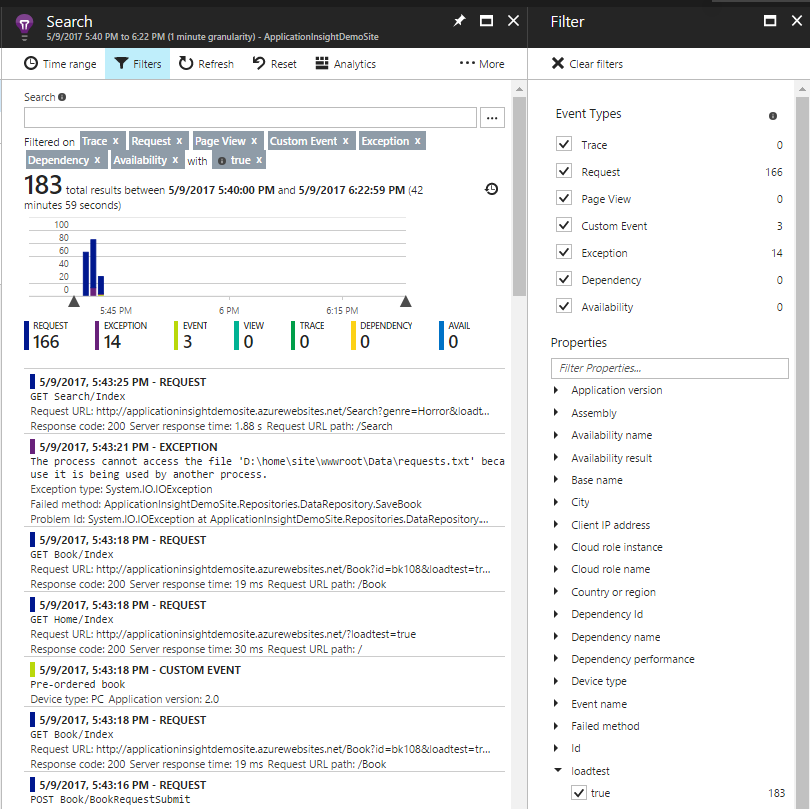
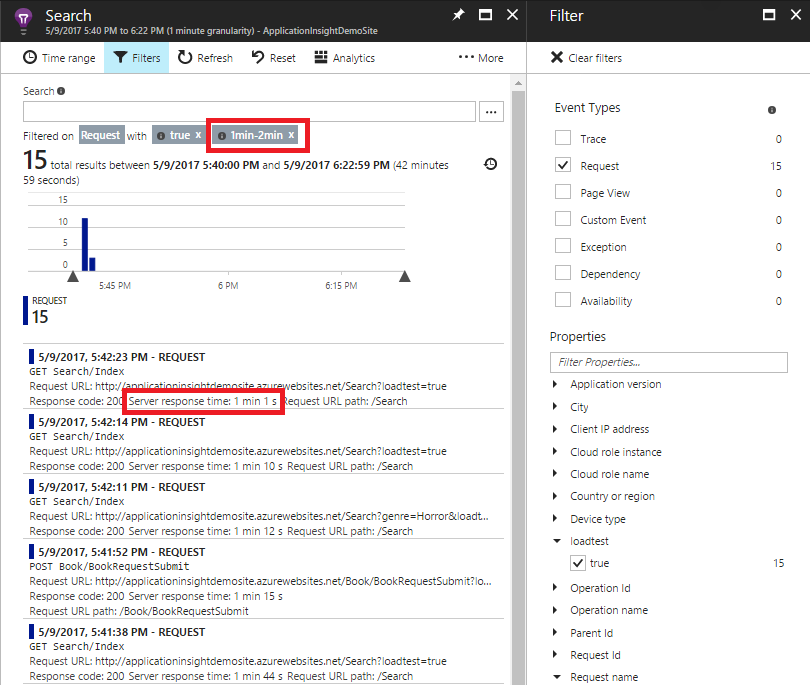
When we look at the status messages of the load test result in Azure, we can see that the load test is executed from one single IP address: 'This load test will run using 1 Internet Protocol (IP) addresses'. This makes it easy to filter only on the telemetry data that was tracked during the load test. Another solution is sending extra meta information for telemetry data during a load test. I've added a query string (loadtest=true) for each request in the web test. In a custom telemetry initializer, I'm checking if the query string is present and then add a custom property for each telemetry data (loadtest=true). Now, I can easily filter on that property in the Application Insights portal.
In the screenshot below, you can see that I'm filtering on the custom property. This search query will provide me only the telemetry data of the load test. Now we can continue investigating the results of the load test. For example, the results of the performance test in Azure indicated some failing request. By only filtering on the custom property and exception we can look at the error message. Should give the same error message as we saw in the test results in Visual Studio, namely: ''The process cannot access the file '\Data\requests.txt' because it is being used by another process".
I'm also pushing a custom event when a book is pre-ordered. This provides more information about the number of successful pre-orders. What we could do with this information is compare the number of exceptions and the number of successful pre-orders.
In the portal, we can also filter on the long-running requests. What I found out is that the search page is extremely slow. Well actually, in the beginning, it's not that bad, but the longer the test runs the longer it takes for completing the search page request. This is again similar as we saw in the test results in Visual Studio where the search page was also the bottleneck. By using custom events, metrics and extra meta information for telemetry data we could provide even more data about the demo application which can be helpful for investigating results of a performance test. For instance, I'm pushing a custom event when a pre-ordered was successfully completed. I could build a very nice dashboard with all the data of the test results:
- Number of successful requests
- Number of failure requests
- Number of pre-orders
- Number of failed pre-orders
- Slowest page request
- Etc.
Now we've analyzed the test results, it's time to solve the performance problems and the exception that is thrown occasionally when a book is pre-ordered.
Solve the problems from the load test results
The outcome of the load test in Visual Studio indicated that an IO exception was thrown: "The process cannot access the file '\Data\requests.txt' because it is being used by another process.". Let's look at the code that is causing this problem:
    public void SaveBookRequest(BookRequestModel model)
    {
        var filename = HostingEnvironment.ApplicationPhysicalPath + _requestsFile;

        File.AppendAllText(filename,
                $"{model.BookId};{model.Name};{model.Email};{model.Address}{Environment.NewLine}");
    }
So the problem occurs when multiple users are accessing the file at the same time. First of all, it's important to always close a file after using it. Since I'm using File.AppendAllText that is being done internally by the .NET framework. Some investigation with ReSharper tells us that using statements are used. However, this isn't enough. I've added a lock on the file that should prevent another process to use the file. This lock is released when the write operation is done.
    private static ReaderWriterLock _locker = new ReaderWriterLock();

    public void SaveBookRequest(BookRequestModel model)
    {
        var filename = HostingEnvironment.ApplicationPhysicalPath + _requestsFile;

        try
        {
            _locker.AcquireWriterLock(int.MaxValue);
            File.AppendAllText(filename,
                $"{model.BookId};{model.Name};{model.Email};{model.Address}{Environment.NewLine}");
        }
        finally
        {
            _locker.ReleaseWriterLock();
        }
    }
The second problem is the performance problems. The search page had an average response time of 21 seconds during the load test which can't be acceptable. Let me sum up the two major problems:
- No paging is used, the XML file contains more than 1000 books.
- For each book, the related books are loaded although they aren't displayed on the search page.
Both problems weren't really an issue while testing on my local machine as you saw in the animation of the user flow earlier. The problems occurred when the example application was under heavy load (during a load test). The first problem is obvious, paging should always be implemented on an overview page. On the other end, think of scenario's where this is not part of the specifications / UX design and a content management system is used as backend system. That means the content editors are in control of the amount of content. At some moment that will cause performance error when paging is not implemented and a lot of content has been added. The second problem, the related books, is a bit related to the first. When paging is implemented this wouldn't immediately lead to performance problems. Of course, if you're not displaying data on the page this shouldn't be loaded in the first place.
Both problems are very easy to solve, but let's look at how the Index action method of the SearchController looked before and after the performance improvements. First how it was at the moment of the performance problems.
       public ActionResult Index(string genre)
        {
            var searchResults = new SearchResults();
            searchResults.Genres = _dataService.GetBookGenres();

            searchResults.Books = _dataService.GetBooks(genre);

            return View(searchResults);
        }
public IEnumerable<Book> GetBooks(string genre, bool includeRelated = true)
{
var xDoc = XDocument.Load(_filename);
var list = new List<Book>();
var elements = Enumerable.Empty<XElement>();
if (!string.IsNullOrEmpty(genre))
{
elements = xDoc.XPathSelectElements("/catalog/book[genre[contains(text(), '" + genre + "')]]");
}
else
{
elements = xDoc.XPathSelectElements("/catalog/book");
}
foreach (var element in elements)
{
list.Add(Book.FromXElement(includeRelated, element));
}
return list;
} public static Book FromXElement(bool includeRelated, XElement el)
{
var book = new Book
{
Id = el.Attribute("id").Value,
Author = el.Element("author").Value,
Title = el.Element("title").Value,
Genre = el.Element("genre").Value,
Price = decimal.Parse(el.Element("price").Value),
Published = el.Element("publish_date").Value,
Description = el.Element("description").Value,
};
if (includeRelated)
{
book.RelatedBooks = new DataService().GetRelatedBooks(book.Genre).Where(x => x.Id != book.Id);
}
return book;
}The index action method will build up a view model. This model includes all book genres for the filters and all books from the XML files. Except for the fact that it might be not a good idea to store all books in an XML file, it's definitely not a good idea to retrieve all books. Especially when the XML file holds more than 1000 books.
The third code snippet shows the method for creating a Book object from an XElement. As you can see the related books are only loaded when the includedRelated parameter is set to true. The GetBooks method contains an optional parameter includeRelated which is set to true by default. The problem is that the GetBooks method is called with only the genre parameter, meaning that the related books are always loaded.
Let's look at the code snippets after fixing the performance problems.
       public ActionResult Index(string genre, string page)
        {
            var paging = new Paging();
            paging.Page = (string.IsNullOrEmpty(page) ? 1 : int.Parse(page));
            paging.PageSize = 20;

            var searchResults = new SearchResults();
            searchResults.Genres = _dataService.GetBookGenres();

            int totalNumber = 0;
            searchResults.Books = _dataService.GetBooks(genre, paging, out totalNumber, false);

            paging.TotalResults = totalNumber;

            searchResults.Paging = paging;

            return View(searchResults);
        }
public IEnumerable<Book> GetBooks(string genre, Paging paging, out int totalNumber, bool includeRelated = true)
{
var xDoc = XDocument.Load(_filename);
var list = new List<Book>();
var elements = Enumerable.Empty<XElement>();
if (!string.IsNullOrEmpty(genre))
{
elements = xDoc.XPathSelectElements("/catalog/book[genre[contains(text(), '" + genre + "')]]");
}
else
{
elements = xDoc.XPathSelectElements("/catalog/book");
}
totalNumber = elements.Count();
if (paging.Page > 0 && paging.PageSize > 0)
{
elements = elements.Skip((paging.Page - 1) * paging.PageSize).Take(paging.PageSize);
}
foreach (var element in elements)
{
list.Add(Book.FromXElement(includeRelated, element));
}
return list;
}Two simple things were implemented. First paging is added to make sure that only a set of books is displayed on the overview page. Secondly, the related items aren't loaded anymore for the search page.
Load test results after performance improvements
It's interesting to find out what the impact is of the performance fixes. It seems that the problems were solved when looking at the results of the load test. If we compare this report with the test result earlier in this blog the differences are significant. Where in the results of the first load test the slowest page was timed at 53 seconds, now the slowest page is only 22 milliseconds. The HTTP 500 server error (file is in use) is also not reported anymore. More facts:
- Average page time from 12,7 to 0,12 seconds.
- The number of failed requests from 7 to 0.
- The number of requests per seconds from 11 to 1447.
Wrap up
When developing your application you may not notice any performance problems. Maybe also not pop up when the customer is testing the application. Usually, performance problems are a combination of issues in code and huge visitor load. Fortunately, we can simulate this in Visual Studio with load testing or in Azure with performance tests. Both will expose your application with a huge visitor load. If there are any performance problems the report of the load test will tell you that. Application Insights can be used to investigate the individual request. The report of the load/performance test and the telemetry data in Application Insights will provide you all the data you need to verify if your application is production-ready.
 Twitter
 LinkedIn
 GitHub