Track telemetry data with Application Insights
Application insights is a great measurement tool which provides you more insights into the usage of your application. This will help you solve exceptions, performance problems and it can even be helpful to improve the user experience of your application if you are interested in that of course. This service can be used for several types of applications, web, mobile and windows applications. Multiple programming languages are supported like .NET, PHP, Phyton, Ruby and many more. Application Insights is a tool for developers. Google Tag Manager provides functionalities that are very similar as Application Insights, but AI (Application Insights) is way too complex for the customer/marketeers. If you only want to use one tool for tracking telemetry data you can export data from Application Insights and import it in PowerBI. Will share my experience with this functionality soon. This blog post will cover the basics to start with Application Insights, but also how you can implement custom tracking which can be valuable to understand what's happening on your website. In this blog, I'll focus on using Application Insights while building web applications with C#/JavaScript.
What does it cost?
Basically, Microsoft offers two pricing plans, basic and enterprise. The basic plan is free and is perfect if you want to try out Application insights. 1 GB of data is included every month. If you exceed that limit $2,30 per GB is charged. You can export data by using continuous export, costs are $0,50 per GB per month. Availability tests can be created as many as you like since those are free, well if you're using URL ping tests. The multi-step web tests cost $10,00 per test per month. The enterprise pricing plan is more for the heavier websites. You'll pay $15,00 per node (your website can run on multiple nodes) per month. 200MB per node per month is included. The costs for the additional data and for the continuous exports are the same as for the basic pricing plan.
You've probably heard this quote about Azure quite often: 'Pay for what you use'. This is not different with Application Insights, so what you probably want is reduce the costs. For Application Insights, you pay for the telemetry data you push from your application. Think carefully what kind of telemetry data is valuable for you. For instance, all image requests are collected and pushed. That can be many requests especially when we talking about an eCommerce site. With the API of Application Insights (no worries I'll explain this later), you can filter out data that you don't want to track.
Learn more about the pricing plans in the documentation.
How can you install Application Insights?
Basically, you've two options here. We can install Application Insights either in the Azure portal or in Visual Studio. I would advise to install it via Visual Studio since you'll be more in control. But it depends of your project. Let start with the portal option.
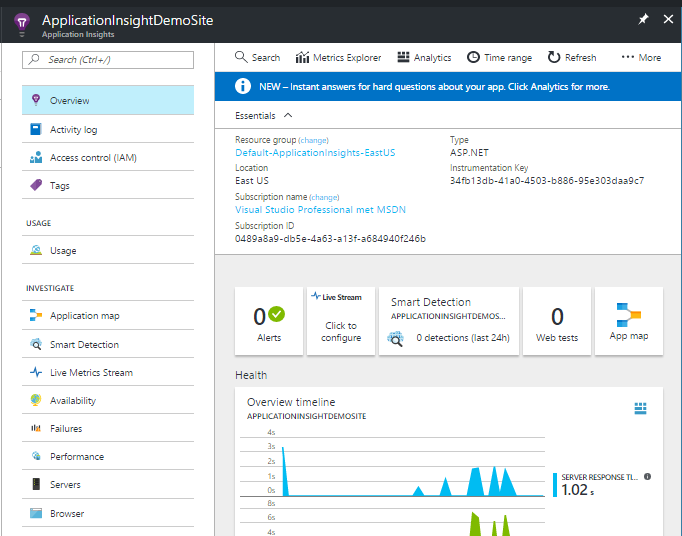
Installing Application Insights in the portal is super simple. When you browse to your app service you'll find the section 'Monitoring' in the left menu. Now, click on Application Insights, this opens a new blade where you have the option to install Application Insights. When you completed the installation steps, your good to go. Telemetry data about your website will immediately be collected and available to you in the portal. This installation option can be handy when you have an existing website running in Azure and want to try out this service. Can also be useful when you're having performance problems on the production environment and you want to monitor your website for a while. The absolute downside of this option is that you need to re-enable Application Insights everytime you deploy your web application.
The second option is to install Application Insights in Visual Studio. If you're creating a new web application in Visual Studio you will get the question whether or not you want to add this service. For existing projects, you can right click your web project in the solution explorer and in the context menu click on add -> Application Insights Telemetry. With the last option (see screenshot below), you'll be able to create a new Application Insights environment or connect to an existing one.
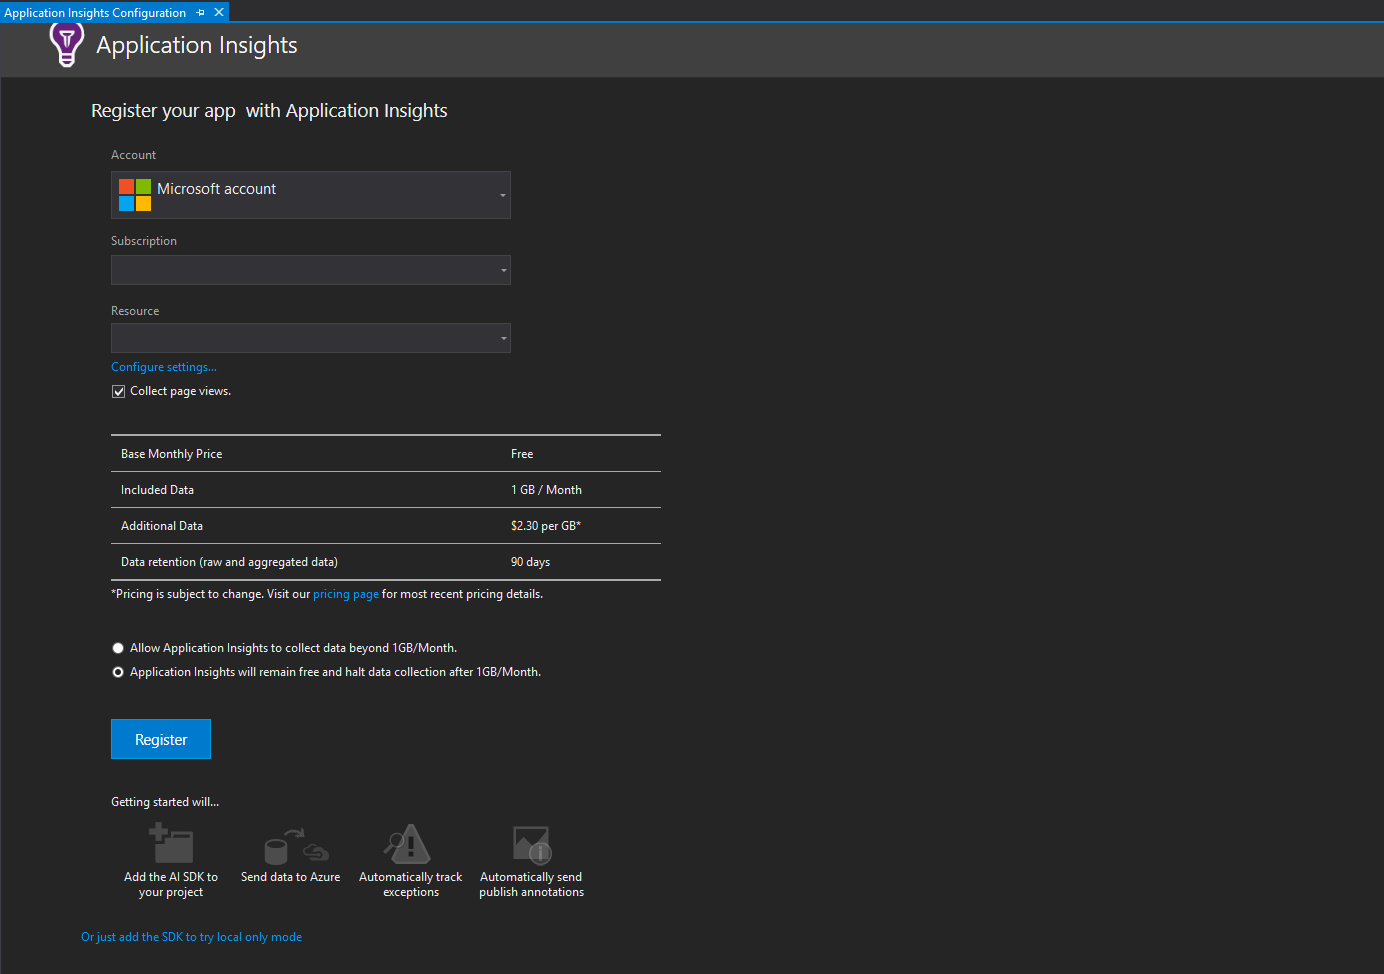
The installation in Visual Studio will also install the necessary NuGet packages and create the applicationinsights.config in the root of your web application. Benefits of this option are that you don't need to re-enable Application Insights in the portal after every deployment. Also that you can configure and customize tracking. I'll explain how you can track your own telemetry data later in this post.
In a typical installation of Application Insight for a web application you'll find the following NuGet packages in your solution:
- Microsoft.ApplicationInsights
-
Microsoft.ApplicationInsights.Agent.Intercept
-
Microsoft.ApplicationInsights.Web
-
Microsoft.ApplicationInsights.WindowsServer
Basically, these packages will get you started without coding a single line of code. There are some extra packages that you can install if you want to collect more data. Here just a few examples of packages you could use in addition:
- Microsoft.ApplicationInsights.Log4NetAppender
- MicrosoftApplicationInsights.DependencyCollector
- MicrosoftApplicationInsights.PerfCounterCollector
I personally find the dependency collector very valuable. It collects data about SQL queries that are executed, but also external web services that are called.
What kind of telemetry data is available in Application Insights?
The default installation of Application Insights collect several kind of telemetry data:
| Page views | Speak for itself, tracks all page views. |
| Requests | All requests, pages, images, stylesheets, scripts, etc. |
| Exceptions | All requests that return exceptions are tracked. 400 and 500 status codes. |
| Dependencies | Queries to the database or calls to external web services. |
| Trace | Trace information is tracked. |
| Events | Events can be tracked via the API. I'll explain how you can do this in the next section. |
| Performance counters | Performance counters provides telemetry data about your servers. |
| Availability | Availability tests can be created in the portal. This can be either URL ping tests or multi-step tests. |
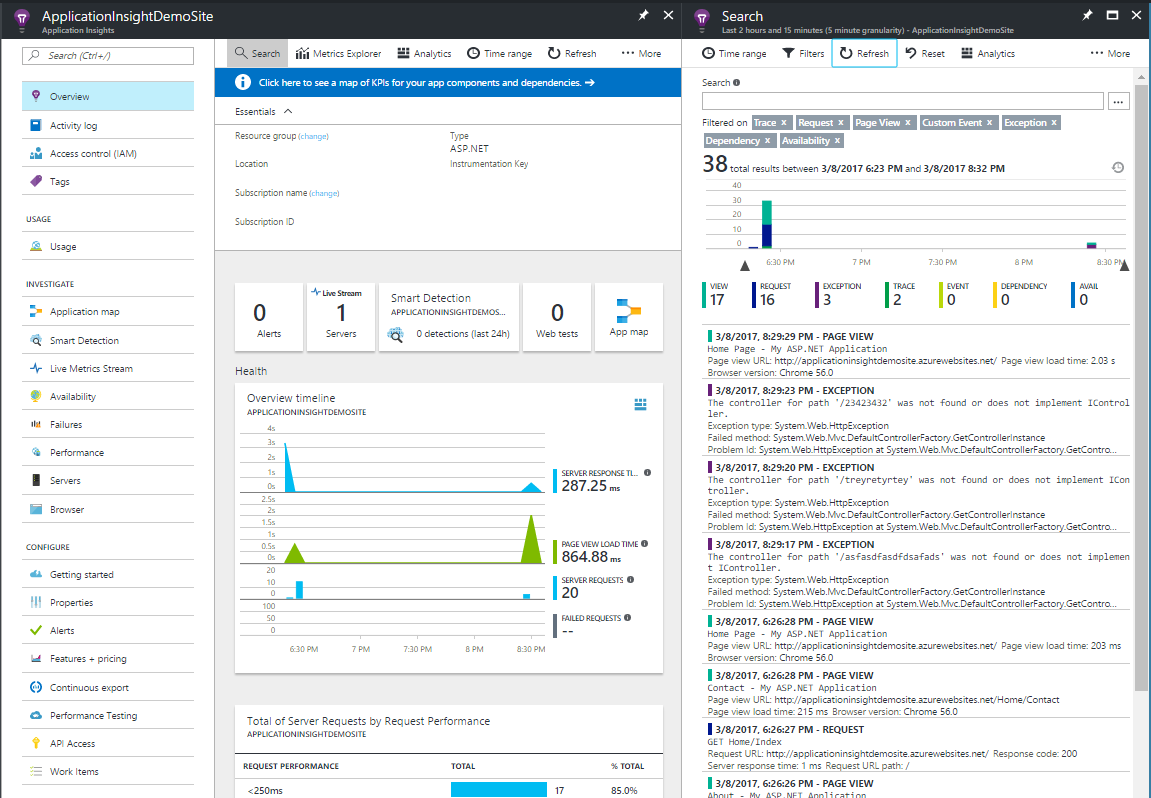
In Application Insights, the telemetry data can be analyzed in several ways. This can be done from different perspectives. For instance, there is a specific blade for investigating the performance or a browser blade that provides insights into the client-side behavior like exceptions and trace information. The live metric blade gives us an overview how the servers are performing and all the failure request on your application. This can be handy to monitor your application with live telemetry data after a deployment. I'm not going into detail here, I think most of the blades are easy to understand and you should just try them out.
Telemetry data is held in memory and pushed in batches to Application Insights. Expect a short delay before the telemetry data appear in the portal. When you're in development mode data is send immediately. You could also persist the telemetry data. This can be useful when you're developing a mobile application. If the app crash the data is still available and can be pushed when the app restarts.
Before I'll handle the custom event and trace tracking, I'll first explain how you can enrich the telemetry data that is pushed and how you can filter out data that you don't need.
Enrich telemetry data with Telemetry Initializers
Telemetry initializers can be useful to enrich the telemetry data that is pushed to Application Insights. The Microsoft.ApplicationInsights.Web package includes initializers that we can use out of the box. We can enable those in the applicationinsights.config or via code. Let's look at the ClientIpHeaderTelemetryInitializer which ships with the package. This class inherits the WebTelemetryInitializerBase class, the OnInitializationTelemetry method needs to be implemented. This method will set the additional information on the telemetry data.
/// <summary>
    /// Implements initialization logic.
    /// </summary>
    /// <param name="platformContext">Http context.</param>
    /// <param name="requestTelemetry">Request telemetry object associated with the current request.</param>
    /// <param name="telemetry">Telemetry item to initialize.</param>
    protected override void OnInitializeTelemetry(HttpContext platformContext, RequestTelemetry requestTelemetry, ITelemetry telemetry)
    {
        if (string.IsNullOrEmpty(telemetry.Context.Location.Ip))
        {
            LocationContext location = requestTelemetry.Context.Location;
            if (string.IsNullOrEmpty(location.Ip))
            {
                this.UpdateRequestTelemetry(platformContext, location);
            }
            telemetry.Context.Location.Ip = location.Ip;
        }
    }
This initializer will set the user IP on every telemetry data that is pushed. What I mention is that we can either configure this initializer in the config or in code:
<TelemetryInitializers>
        <Add Type="Microsoft.ApplicationInsights.DependencyCollector.HttpDependenciesParsingTelemetryInitializer, Microsoft.AI.DependencyCollector" />
        <Add Type="Microsoft.ApplicationInsights.WindowsServer.AzureRoleEnvironmentTelemetryInitializer, Microsoft.AI.WindowsServer" />
        <Add Type="Microsoft.ApplicationInsights.WindowsServer.AzureWebAppRoleEnvironmentTelemetryInitializer, Microsoft.AI.WindowsServer" />
        <Add Type="Microsoft.ApplicationInsights.WindowsServer.BuildInfoConfigComponentVersionTelemetryInitializer, Microsoft.AI.WindowsServer" />
        <Add Type="Microsoft.ApplicationInsights.Web.WebTestTelemetryInitializer, Microsoft.AI.Web" />
        <Add Type="Microsoft.ApplicationInsights.Web.SyntheticUserAgentTelemetryInitializer, Microsoft.AI.Web">
          <Filters>search|spider|crawl|Bot|Monitor|AlwaysOn</Filters>
        </Add>
        <Add Type="Microsoft.ApplicationInsights.Web.ClientIpHeaderTelemetryInitializer, Microsoft.AI.Web" />
        <Add Type="Microsoft.ApplicationInsights.Web.OperationNameTelemetryInitializer, Microsoft.AI.Web" />
        <Add Type="Microsoft.ApplicationInsights.Web.OperationCorrelationTelemetryInitializer, Microsoft.AI.Web" />
        <Add Type="Microsoft.ApplicationInsights.Web.UserTelemetryInitializer, Microsoft.AI.Web" />
        <Add Type="Microsoft.ApplicationInsights.Web.AuthenticatedUserIdTelemetryInitializer, Microsoft.AI.Web" />
        <Add Type="Microsoft.ApplicationInsights.Web.AccountIdTelemetryInitializer, Microsoft.AI.Web" />
        <Add Type="Microsoft.ApplicationInsights.Web.SessionTelemetryInitializer, Microsoft.AI.Web" />
      </TelemetryInitializers>
protected void Application_Start()
{
AreaRegistration.RegisterAllAreas();
FilterConfig.RegisterGlobalFilters(GlobalFilters.Filters);
RouteConfig.RegisterRoutes(RouteTable.Routes);
BundleConfig.RegisterBundles(BundleTable.Bundles);
TelemetryConfiguration.Active.TelemetryInitializers.Add(new ClientIpHeaderTelemetryInitializer());
}Of course, you could create your own initializer by inheriting the WebTelemetryInitializerBase (or ITelemetryInitializer) class and configure it.
Filter out telemetry data with Telemetry Processors
With telemetry processors, you can filter out data that you don't want in Application Insights. There are two reasons why you should do this, first you don't want data in Application Insights that you will not analyze. The portal has some good search and filter capabilities, but less is more. Second, one of the goals when using Azure services should be reducing the costs. You'll be charged for the data that is pushed to Application Insights, you need to consider what data is valuable for you. Like the initializer, you can configure a processor either in the configuration file or via code. You can create your own processor by inheriting the ITelemetryProcessor interface. Below an example of filtering out all requests that return a 404 response code and how could configure the processor.
public class NotFoundFilter : ITelemetryProcessor
    {
        private ITelemetryProcessor Next { get; set; }

        public NotFoundFilter(ITelemetryProcessor next)
        {
            this.Next = next;
        }

        public void Process(ITelemetry item)
        {
            var request = item as RequestTelemetry;

            if (request != null &&
            request.ResponseCode.Equals(((int)HttpStatusCode.NotFound).ToString(), StringComparison.OrdinalIgnoreCase))
            {
                // To filter out an item, just terminate the chain:
                return;
            }
            // Send everything else:
            this.Next.Process(item);
        }
    }
<TelemetryProcessors>
      <Add Type="Microsoft.ApplicationInsights.Extensibility.PerfCounterCollector.QuickPulse.QuickPulseTelemetryProcessor, Microsoft.AI.PerfCounterCollector" />
      <Add Type="Microsoft.ApplicationInsights.WindowsServer.TelemetryChannel.AdaptiveSamplingTelemetryProcessor, Microsoft.AI.ServerTelemetryChannel">
        <MaxTelemetryItemsPerSecond>5</MaxTelemetryItemsPerSecond>
      </Add>
      <Add Type="ApplicationInsightDemoSite.NotFoundFilter, ApplicationInsightDemoSite" />
    </TelemetryProcessors>
protected void Application_Start()
{
AreaRegistration.RegisterAllAreas();
FilterConfig.RegisterGlobalFilters(GlobalFilters.Filters);
RouteConfig.RegisterRoutes(RouteTable.Routes);
BundleConfig.RegisterBundles(BundleTable.Bundles);
TelemetryConfiguration.Active.TelemetryInitializers.Add(new ClientIpHeaderTelemetryInitializer());
var builder = TelemetryConfiguration.Active.TelemetryProcessorChainBuilder;
builder.Use((next) => new NotFoundFilter(next));
builder.Build();
}Track telemetry data yourself with the API
What I already mention is that out-of-the-box a lot of telemetry data is collected and available in Application Insights. An API is provided by Microsoft to customize tracking, for example, enrich the telemetry data with other useful information, filter out data and push your own data to Application Insights. In this section, I'll explain each part.
In a web application, we either can use the JavaScript API or the C# API. Whether you are using the client or server side API, it's super simple. Events can be used to provide more insights how visitors are using your web application. Again we can push events both client and server side. An example of a client-side event can be that a visitor opens/close a popup or use filters/categories on a complex search page. Let's start with an example how you can push a client-side event. In the code snippet, an event is pushed when an anchor with the class 'home-page-link' is clicked.
$(document).ready(function() {
        $(".home-page-link").click(function() {
            window.appInsights.trackEvent("homePageLinkClicked", $(this).text());
        });
    });
[HttpPost]
[AllowAnonymous]
[ValidateAntiForgeryToken]
public async Task<ActionResult> Login(LoginViewModel model, string returnUrl)
{
if (!ModelState.IsValid)
{
return View(model);
}
// This doesn't count login failures towards account lockout
// To enable password failures to trigger account lockout, change to shouldLockout: true
var result = await SignInManager.PasswordSignInAsync(model.Email, model.Password, model.RememberMe, shouldLockout: false);
switch (result)
{
case SignInStatus.Success:
return RedirectToLocal(returnUrl);
case SignInStatus.LockedOut:
return View("Lockout");
case SignInStatus.RequiresVerification:
return RedirectToAction("SendCode", new { ReturnUrl = returnUrl, RememberMe = model.RememberMe });
case SignInStatus.Failure:
default:
var dic = new Dictionary<string, string>();
dic.Add("email", model.Email);
_telemetryClient.TrackEvent("InvalidLogin", dic);
ModelState.AddModelError("", "Invalid login attempt.");
return View(model);
}
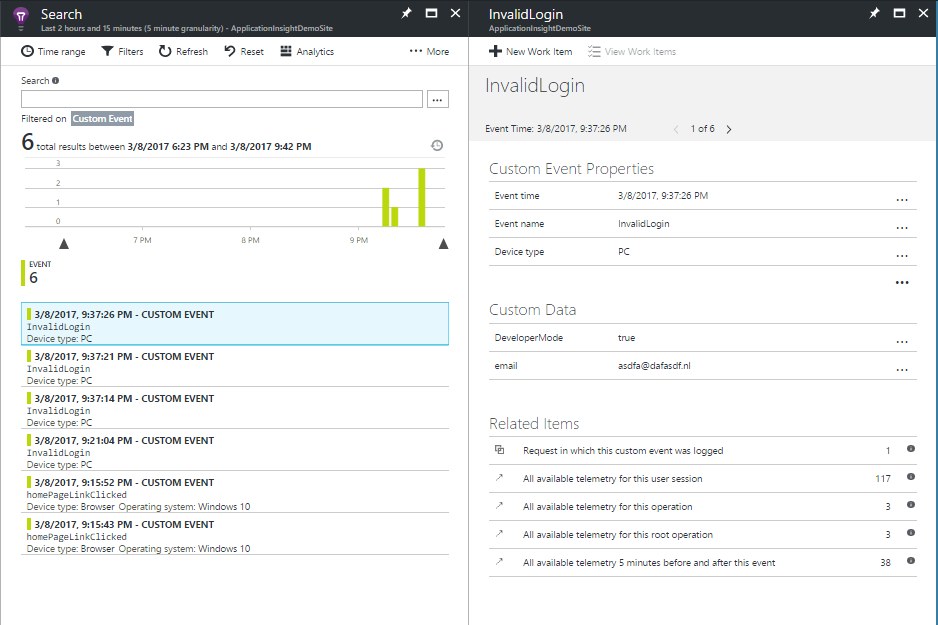
}In the second code snippet, the TrackEvent method from the TelemetryClient class is called. You can pass additional data for this event in the second parameter of the method. In this example, I push an event when the visitor fails to login. The entered email address is set in the dictionary. The additional data for an event will appear in Application Insights.
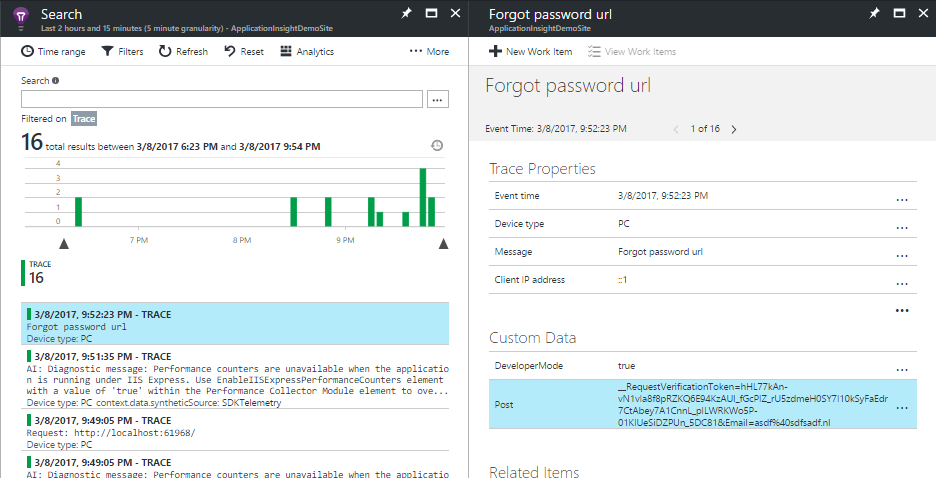
Default the post parameters aren't pushed to Application Insights. We could send this information in two ways. We can create a telemetery initializer and enrich the telemetry data with the post parameters. Or we can use the Track method (JavaScript or C#) to push this information to Application Insights.
[HttpPost]
    [AllowAnonymous]
    [ValidateAntiForgeryToken]
    public async Task<ActionResult> ForgotPassword(ForgotPasswordViewModel model)
    {
        if (ModelState.IsValid)
        {
            var postVariables = Request.Form.ToString();

            var dic = new Dictionary<string, string>();
            dic.Add("Post", postVariables);

            _telemetryClient.TrackTrace("Forgot password url", dic);

            var user = await UserManager.FindByNameAsync(model.Email);
            if (user == null || !(await UserManager.IsEmailConfirmedAsync(user.Id)))
            {
                return View("ForgotPasswordConfirmation");
            }
        }
        return View(model);
    }
Events and trace information are just two examples of custom telemetry data that we can push ourselves. Other methods for pushing data are:
- TrackAvailability
- TrackDependency
- TrackException
- TrackMetry
- TrackPageView
- TrackRequest
Be aware that you don't track unnecessary data. Only do this when this can be valuable to solve issues, understand the usage of your application or other valid reasons.
Let's wrap up
Application Insights gives a lot of insights into the usage and performance of your application. You can investigate your data in the portal in several ways. When you're not satisfied with the telemetry data that's tracked by default, you can track telemetry data yourself by using the server or client-side API. This can help you solve exceptions, improve the performance of your application, and much more. In the next blog, I'll explain how data is tracked for a user session and how that can be helpful to reproduce errors. I'll also explain how you can export telemetry data and import it in PowerBI.
 Twitter
 LinkedIn
 GitHub