Use Power BI to build interactive visualizations based on Application Insights telemetry data
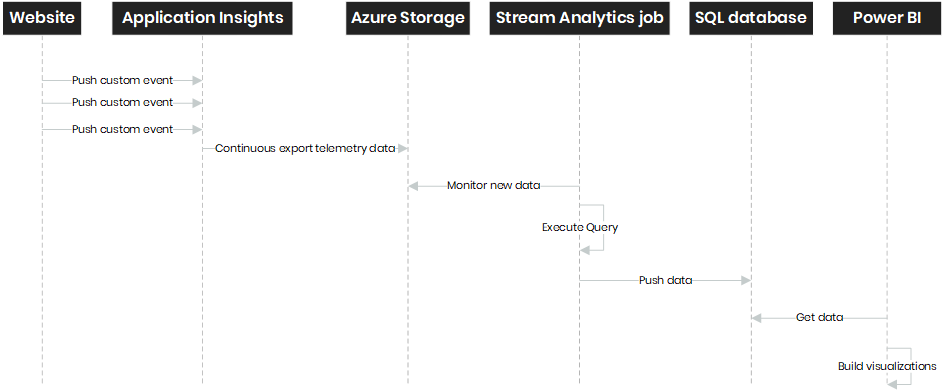
I already wrote some blogs about how you can configure Application Insights and how it can be a useful tool for monitoring your application. In this blog, I'll cover another useful feature. Microsoft is constantly improving the portal of Application Insights to provide meaningful information about your application. Currently, the portal contains a new (preview) ‘Usage’ blade that includes some advanced filtering capabilities. Unfortunately, telemetry data in Application Insights is not stored forever. The data is only kept for 90 days. In this blog, I’ll cover how you can export Application Insights telemetry data and how Power BI can be used to build powerful visualizations based on telemetry data.
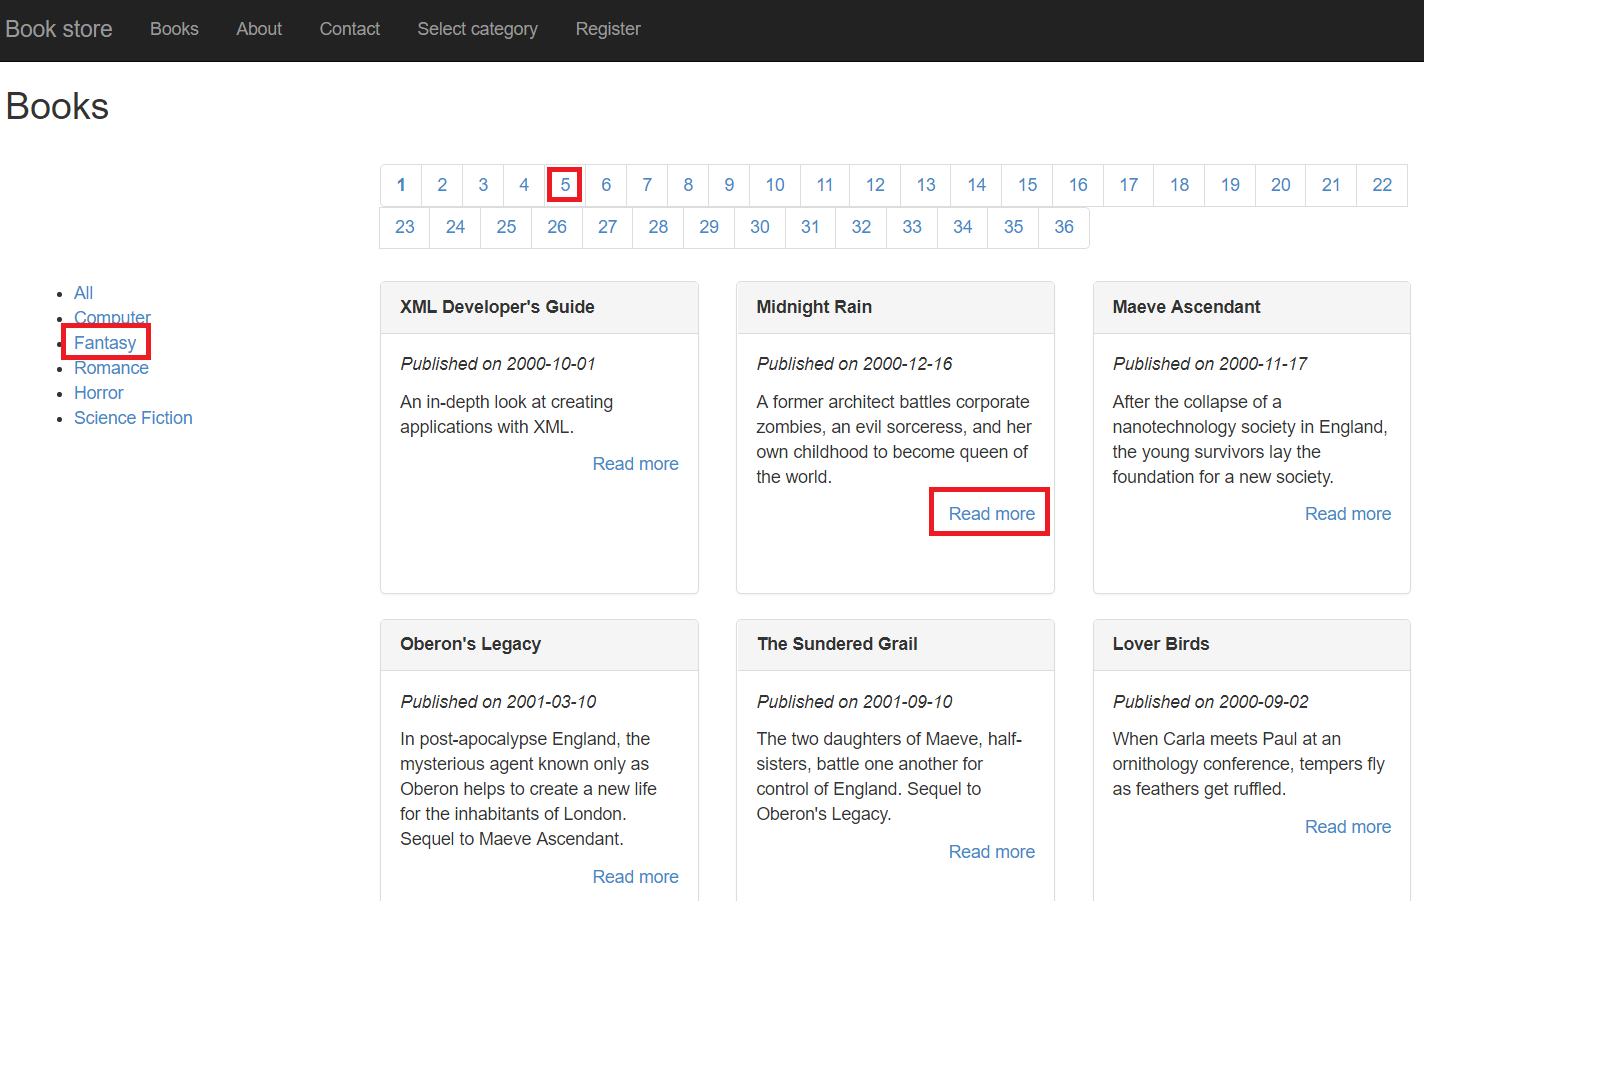
Use custom events to track user interactions
Application Insights provides useful information about your application like the performance, exceptions, measurements, and usage. With the Application Insights API, it’s possible to push custom events that can track what the user behavior is on your website. For this example, I created a simple website based on one of the MVC sample site of Microsoft. I enabled Application Insights by installing the NuGet packages and creating an Application Insights resource in Azure. Read more about configuring Application Insights in this blog post. Basically, there are two ways for tracking custom events, server-side in C# or client side with JavaScript. I'm using both ways on my sample site. Below an example how you can push a custom event in C# and in JavaScript.
var dic = new Dictionary<string, string>();
dic.Add("category", category);

_telemetryClient.TrackEvent("categorySelected", dic);
<script>
$(document).ready(function () {
$(".pre-order-button").click(function () {
var data = {};
data.book = "@Model.Title";
window.appInsights.trackEvent("preOrderButtonClick", data);
window.location = '/Book/[email protected]';
});
});
</script>In the example website, I push custom events when visitors click on links and submit forms. In the screenshot below, you can see the interactions on the search page that I’m tracking. In some occasions, you would like to send extra information about an event. By default, Application Insights is collection context information when an event is tracked. Information about the visitor's device, browser, and their location is sent to Application Insights. Like I showed in the code examples, it’s possible to send more information about an event. For example, which link is clicked or the form entries.
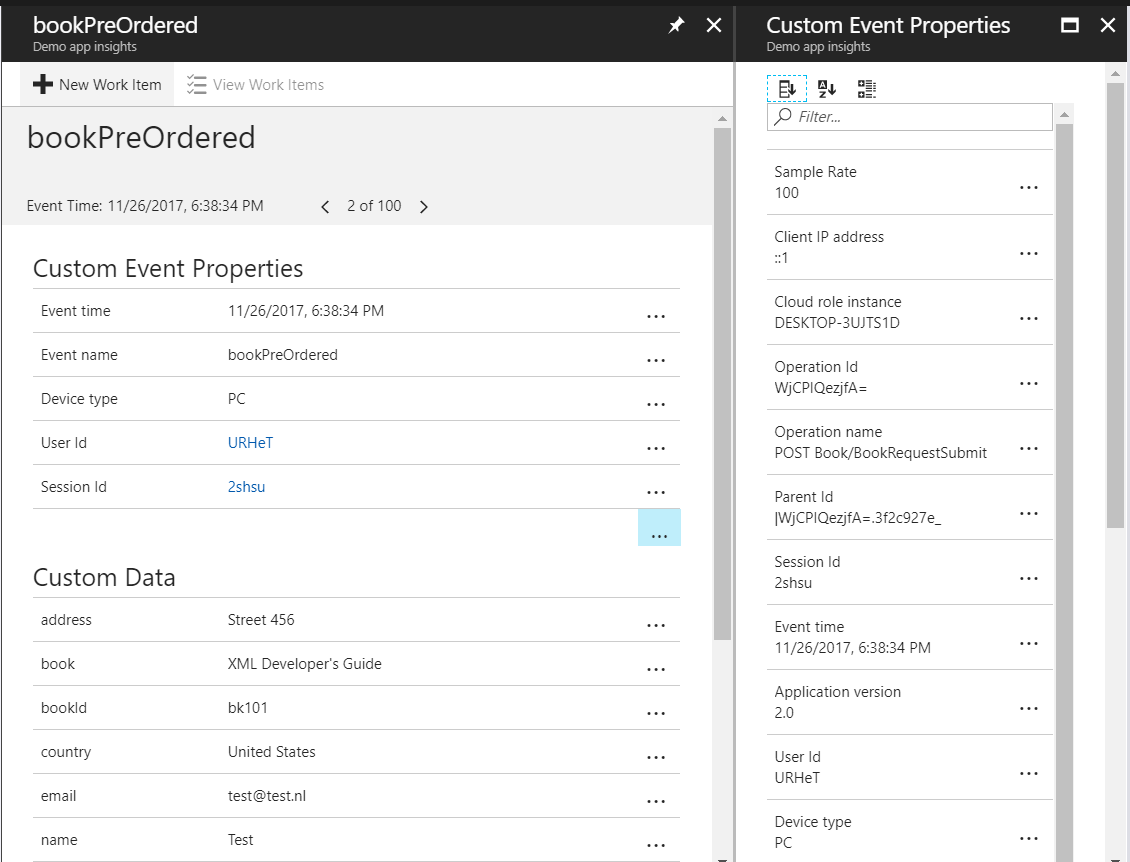
The portal of Application Insights provides multiple ways to filtering and querying telemetry data. One of the most flexible blades is the search blade. In this blade, you can filter on a time range or telemetry type, using facets, and execute a search. In the portal, you’ll also see the custom data that is pushed with the tracked event, as you can see below.
It’s most likely you would like to search and filter events older than the 90 days that Application Insights offer. Here is where the continuous export functionality comes in. In the next section, I’ll explain how this works.
Configure continuous exports for exporting telemetry data
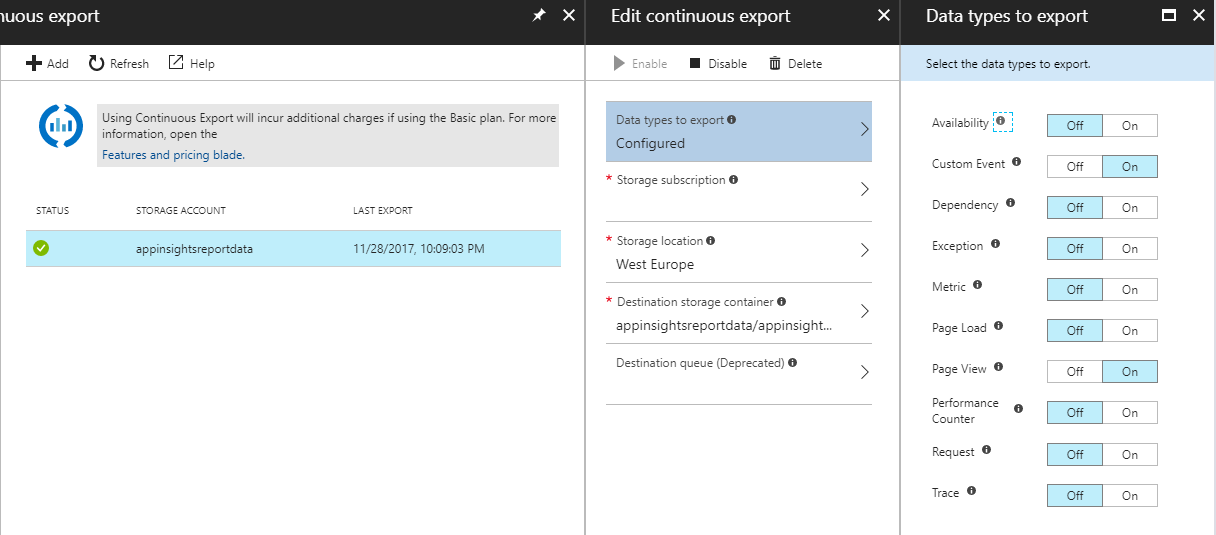
Like I said earlier, telemetry data is only kept for 90 days. In most scenarios that is probably enough, because, for instance, a page will stay slow if you don’t do anything about it. So it’s not really efficient to have that same telemetry data x times. You can use custom events to track interactions like when a visitor clicks on a button or executes a search on the website. It’s more likely that you would like to store this kind of information longer than the 90 days that Application Insights offers. In the portal, telemetry data can be exported by using the feature ‘Continuous export’. Note, that this feature is disabled when you have a subscription with credits. Microsoft is also charging an amount per GB every month when using the Basic plan when you use the Enterprise plan you don’t need to worry because it’s already included. You can find the continuous export feature under the menu ‘Configure’. A storage account must be selected to store telemetry data as JSON files. You can select which telemetry data you want to export, options here are: availability, custom events, dependency, exception, metric, page load, page view, performance counter, request, and trace.
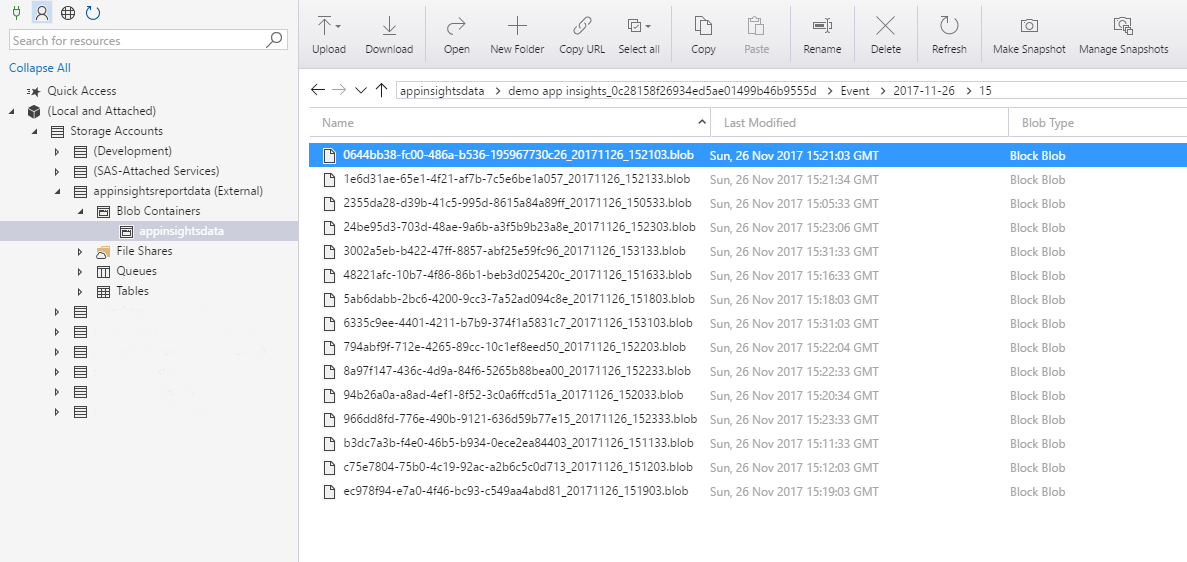
Application Insights is using a specific folder structure for saving the JSON files: Application Insights resource name + guid/telemetry type/date/hour/. Each filename includes a unique guid, the date and time. One JSON file can hold one or multiple telemetry items (pageview, event, dependency, etc).
There is not a limit for the number of data that is exported. The only limit is the max size of the Azure storage account, but that goes up to 500GB. It’s not likely that you will hit that limit with exporting telemetry data.
Use a Stream Analytics job to push exported telemetry data to a SQL database
The continuous export feature of Application Insights lets us keep telemetry data longer than 90 days. All this exported telemetry data is kinda useless if we don’t do anything with it. Exporting is one thing, but the next step is to do something with this data. That is where the Azure Stream Analytics job steps in. A Stream Analytics job can process data real time, that means the moment a new event, file or another kind of data pops up in the input data source it will be processed by the job. The job let us define an input and output data source. It’s basically a way of copying efficiently data between resources. This feature also allows us to write a query that explicitly tells which data should be transferred to the output data source. A stream analytics job instance is build up of the following parts:
| Input | This is the source, options are events hub, blob storage or IoT hub. |
| Function | Functions can be called in the query, e.g. transforming data. |
| Query | Stream Analytics query language. Query the data from the input data source. |
| Output | Output data source to push the data to. Options are SQL database, blob storage, event hub, table storage, service bus queue, service bus topic, cosmos DB, Power BI, data lake store, azure function. |
Like I said earlier telemetry data is stored as a JSON file on Azure storage location. Below an example of an exported custom event.
{
	"event": [
		{
			"name": "searchPageFilterClick",
			"count": 1
		}
	],
	"internal": {
		"data": {
			"id": "6f322640-d471-11e7-a499-e9a411b4f900",
			"documentVersion": "1.61"
		}
	},
	"context": {
		"data": {
			"eventTime": "2017-11-28T19:22:14.382Z",
			"isSynthetic": false,
			"samplingRate": 100
		},
		"device": {
			"id": "browser",
			"type": "Browser",
			"osVersion": "Windows 10",
			"deviceName": "Other",
			"deviceModel": "Other",
			"browser": "Chrome",
			"browserVersion": "Chrome 62.0",
			"screenResolution": {}
		},
		"user": {
			"anonId": "URHeT",
			"isAuthenticated": false
		},
		"session": {
			"id": "rYO1o",
			"isFirst": false
		},
		"operation": {
			"id": "0Z9Ql",
			"parentId": "0Z9Ql",
			"name": "/Search"
		},
		"location": {
			"clientip": "0.0.0.0",
			"continent": "Europe",
			"country": "Netherlands",
			"province": "North Holland",
			"city": "Amsterdam"
		},
		"custom": {
			"dimensions": [
				{
					"filter": "Fantasy"
				}
			]
		}
	}
}
So the Stream Analytics job monitors the Azure storage location if new blob files have been added. Then it will execute the defined query to process the data. That processing is built up of some steps.
- Get blob file (JSON) from Azure storage location
-
Execute defined query
- Select data from the JSON
- Transform data if necessary (use functions)
- Insert data to the defined output source
- Push data to defined output source
It’s possible to define Power BI as an output, that means that data is pushed to Power BI immediately. With Power Bi you can store up to 10GB of data. If you expect that 10GB is not enough or you want to use the data for other purposes as well you can choose other output options. For this example, I’ll use a SQL database.
As you can see in the example of one of the JSON file, the custom data is defined in an array (custom/dimensions). I want to push the data to one SQL database table so that means I need to transform the custom data in order to be ‘flat’. By that, I mean that all entries in the dimensions array will be inserted in a separate defined column. To transform data we can use Functions. Functions can be written in JavaScript or with Azure ML. I decided to create a simple JavaScript function. This method accepts the dimension variable and basically what it does is returning a flat object.
function main(dimensions) {
  let output = {};
  for(let i in dimensions) {
    let dim = dimensions[i];
    for(let key in dim) {
      output[key] = dim[key];
    }
  }
  return output;
}
For writing the Query you need to use the Stream Analytics Language, which is somehow similar to SQL. The WITH statement lets us define a temporary naming result set what can be used later. In the first result set (CustomValues) I flatten the dimension array (custom data) and selecting all context information stored at the event. In the EventTelemetryData and PageViewTelemetryData resultset, I’m selecting and parsing the data that I want to push to the defined output. When choosing a SQL database it’s important to know that the column names must be identical to the naming in the SELECT statement. In the query, you can see that I’m pushing event and page view telemetry data to two separate SQL tables.
WITH
CustomValues AS
(
    SELECT
        flat.arrayvalue as event,
        A.context as context,
        UDF.flattenCustomDimensions(A.context.custom.dimensions) as customDimensions
    FROM [appinsightseventsexport] A
    OUTER APPLY GetElements(A.event) as flat
),
EventTelemetryData AS
(
SELECT
    event.name as "event.name",
    CAST(context.data.eventTime as datetime) as "event.time",
    context.device.browser as "device.browser",
    context.device.browserVersion as "device.browserVersion",
    context.device.deviceModel as "device.deviceModel",
    context.device.deviceName as "device.deviceName",
    context.device.id as "device.id",
    context.device.locale as "device.locale",
    context.device.network as "device.network",
    context.device.oemName as "device.oemName",
    context.device.osVersion as "device.osVersion",
    context.device.roleInstance as "device.roleInstance",
    context.device.roleName as "device.roleName",
    context.device.type as "device.type",
    context.[user].accountAcquisitionDate as "user.accountAcquisitionDate",
    context.[user].anonAcquisitionDate as "user.anonAcquisitionDate",
    context.[user].anonId as "user.anonId",
    context.[user].authAcquisitionDate as "user.authAcquisitionDate",
    context.[user].isAuthenticated as "user.isAuthenticated",
    context.session.id as "session.id",
    context.session.isFirst as "session.isFirst",
    context.operation.id as "operation.id",
    context.operation.name as "operation.name",
    context.operation.parentId as "operation.parentId",
    context.location.city as "location.city",
    context.location.clientip as "location.clientip",
    context.location.continent as "location.continent",
    context.location.country as "location.country",
    context.location.province as "location.province",
    CustomValues.customDimensions.email as "custom.email",
    CustomValues.customDimensions.name as "custom.name",
    CustomValues.customDimensions.address as "custom.address",
    CustomValues.customDimensions.country as "custom.country",
    CustomValues.customDimensions.bookId as "custom.bookId",
    CustomValues.customDimensions.book as "custom.book",
    CustomValues.customDimensions.category as "custom.category",
    CustomValues.customDimensions.linkText as "custom.linkText",
    CustomValues.customDimensions.linkUrl as "custom.linkUrl",
    CustomValues.customDimensions.filter as "custom.filter",
    CustomValues.customDimensions.page as "custom.page"
FROM
      CustomValues
),
PageViewTelemetryData AS
(
SELECT
    flat.arrayvalue.name as "view.name",
    flat.arrayvalue.url as "view.url",
    CAST(A.context.data.eventTime as datetime) as "event.time",
    A.context.device.browser as "device.browser",
    A.context.device.browserVersion as "device.browserVersion",
    A.context.device.deviceModel as "device.deviceModel",
    A.context.device.deviceName as "device.deviceName",
    A.context.device.id as "device.id",
    A.context.device.locale as "device.locale",
    A.context.device.network as "device.network",
    A.context.device.oemName as "device.oemName",
    A.context.device.osVersion as "device.osVersion",
    A.context.device.roleInstance as "device.roleInstance",
    A.context.device.roleName as "device.roleName",
    A.context.device.type as "device.type",
    A.context.[user].accountAcquisitionDate as "user.accountAcquisitionDate",
    A.context.[user].anonAcquisitionDate as "user.anonAcquisitionDate",
    A.context.[user].anonId as "user.anonId",
    A.context.[user].authAcquisitionDate as "user.authAcquisitionDate",
    A.context.[user].isAuthenticated as "user.isAuthenticated",
    A.context.session.id as "session.id",
    A.context.session.isFirst as "session.isFirst",
    A.context.operation.id as "operation.id",
    A.context.operation.name as "operation.name",
    A.context.operation.parentId as "operation.parentId",
    A.context.location.city as "location.city",
    A.context.location.clientip as "location.clientip",
    A.context.location.continent as "location.continent",
    A.context.location.country as "location.country",
    A.context.location.province as "location.province"
    FROM [appinsightspageviewsexport] A
    OUTER APPLY GetElements(A.[view]) as flat
)

SELECT * INTO reportEventsSql FROM EventTelemetryData
SELECT * INTO reportPageViewsSql FROM PageViewTelemetryData
Build visualizations with Power BI to investigate Application Insights telemetry data
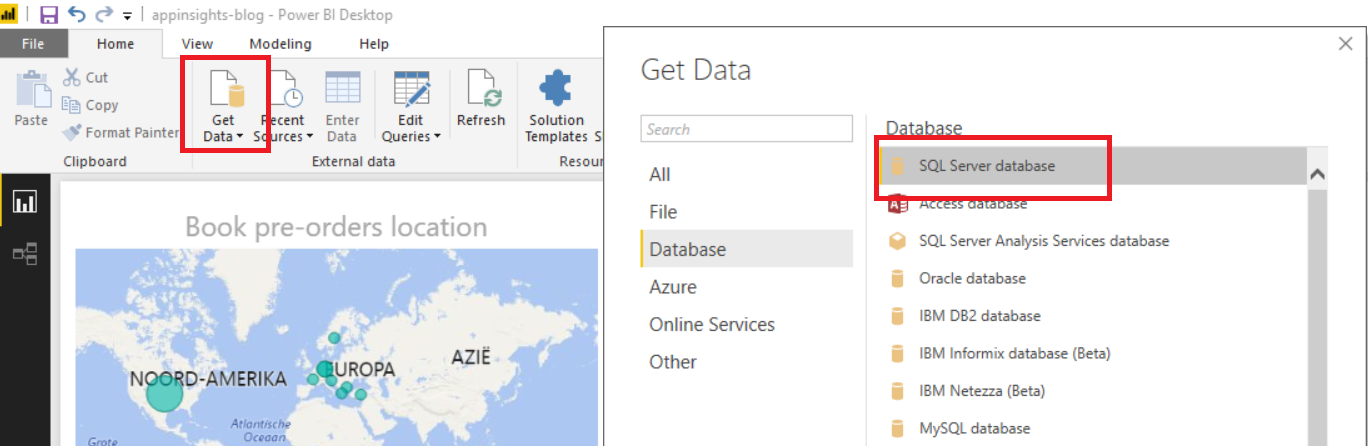
Microsoft provides three licenses for Power BI, Power BI Desktop (free), Pro and Enterprise. The free option will provide plenty of features to start with. For this example, I’ll use Power BI Desktop which can be downloaded from powerbi.microsoft.com. In this application, I’ll start by connecting to a SQL database. By default Power BI offers integrations to several data sources. One of those is a connection to a SQL database. This can be done by clicking the ‘Get Data’ button in the ribbon menu. This will opens a popup that contains an overview of all the integration options. After selecting the SQL Server database you’ll need to provide connection credentials.
Power BI provides two options to fetch data from a SQL database, import or direct query. Import will fetch all data from the database and store it in Power Bi Desktop. When publishing a report to the online environment the data is saved in Azure. Direct query will not import the data but will execute queries to the database. After selecting one of the two options the data should be available in Power Bi.
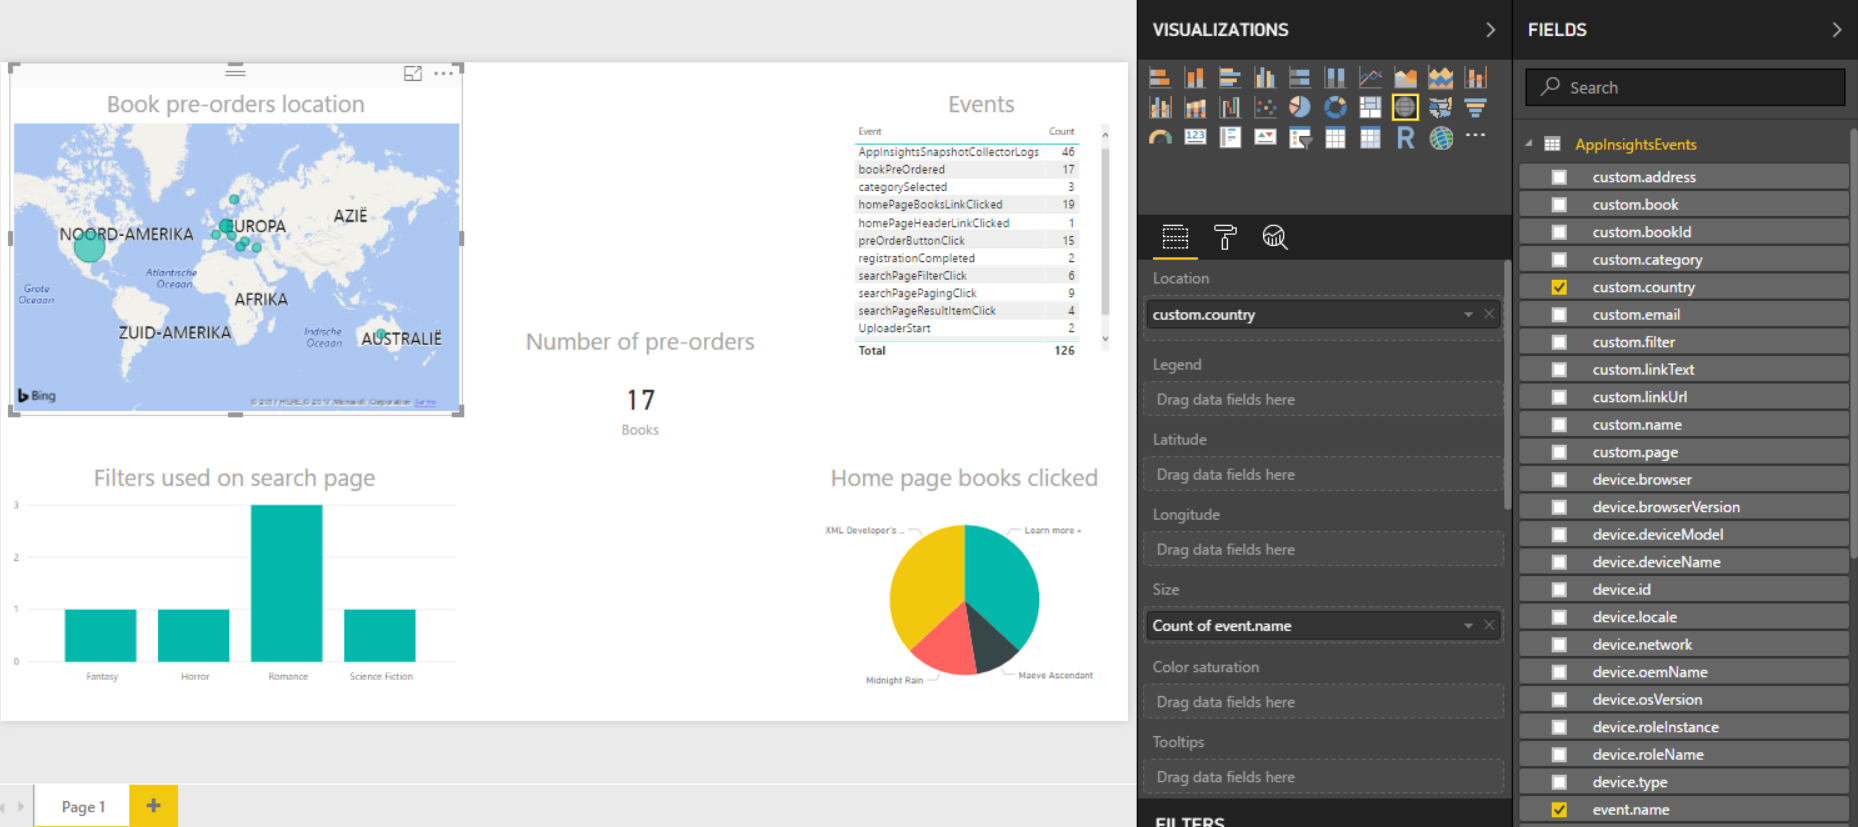
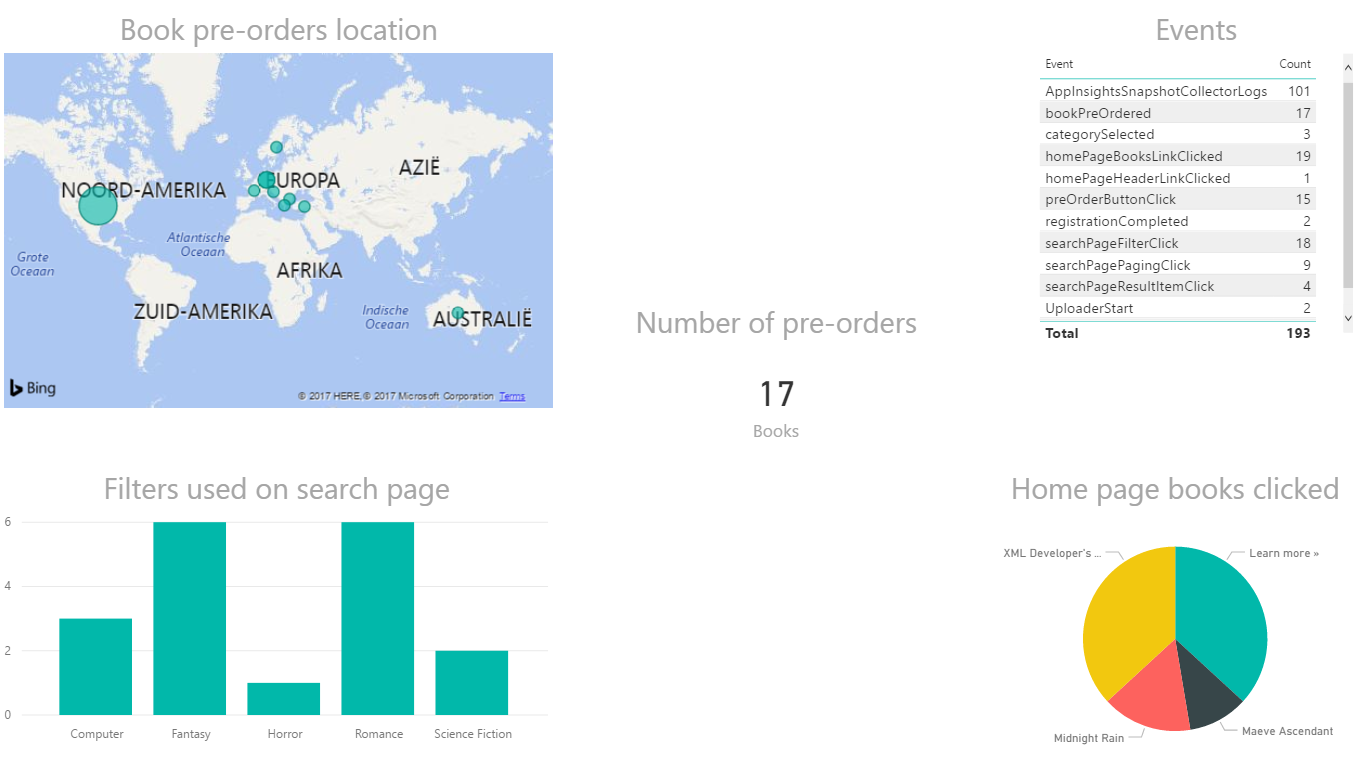
I will not explain how Power BI works in detail, but will briefly describe how I built this report. As you can see the right side contains all data fields. Basically, these are the columns defined in the SQL table, which were filled by the Stream Analytics job. So all context information that is collected by Application Insights and the custom data that I pushed in the demo application. Power Bi provides a number of different charts that can be used for building visualization based on data. For instance, the map visualization in the left top corner only needs a ‘location’ field. This can be country, province or city field, Bing Maps will lookup the location and place a dot on the map. Further, I’ve used a table, column, pie chart and a card. After selecting a chart it’s basically selecting the right data fields and configure them accordingly. Dashboards and reports can be synced to the online environment of Power BI. In this environment, you can share dashboard with colleagues.
Summarize
Application Insights provides some good tools to investigate the usage of your application. One limitation is that data is kept for only 90 days. If you would like to found out how users are using your website you probably want to go back further than 90 days. Fortunately, Application Insights offers functionality to export telemetry data to an Azure storage location. Data will be saved as JSON file in a date-time folder structure. A Stream Analytics job can be used to push the data to a SQL database. Power Bi is a perfect tool to build interactive visualizations. In Power BI you can connect to the SQL database to sync the data.
Please leave a comment below, I would love to get feedback and hear about your ideas.
 Twitter
 LinkedIn
 GitHub