Investigate Application Insights telemetry data directly in Visual Studio
This is the third blog post I wrote about Application Insights. In this blog post, I'll explain how you can investigate telemetry data directly in Visual Studio. If you haven't read my previous blog then it would be useful to do that first. In that blog, I explained how Application Insights can help you solve exceptions in your application. Based on an example application I explained how you can reproduce the steps a visitor took before an exception occurred. I'll use the same example application in this blog.
Visual Studio 2017 was released the 9th of February. You can read the full release notes of Visual Studio 2017 here. This new version contains some cool new features related to Application Insights. I'll start with the new integration of Application Insights in CodeLens. Then I'll cover the already existed Application Insights Search and Trends window in Visual Studio. Both windows provide the developer the ability to investigate telemetry data directly in Visual Studio. Lastly, I'll explain how you can track the current version of your application and how you can use release annotations to tell Application Insights when you've done a deployment.
Use CodeLens to investigate telemetry data in Visual Studio
The release of Visual Studio 2017 contains some great updates for CodeLens. If you've enabled Application Insights in your Visual Studio solution then CodeLens will display telemetry data. Never heard about CodeLens before, read about it first. In previous versions of CodeLens, information like references to code, source control information, test results and more was already displayed. Now Application Insights is also part of CodeLens. Let me explain some of the new features based on the example application I used in my previous blog post. If you look at the screenshot below this paragraph, you'll see CodeLens in action. The CodeLens labels can be found above each class, method, etc. What you see in the screenshot, are three labels above the Index action method. The first one is the code references label which displays all references to this particular method. The second and third label are related to Application Insights. In the second label, we see the number of requests to this action method. Note when you click on the pin button (in the screenshot marked with a red border), the information will be pinned in the bottom panel of Visual Studio. What we also see is the number of failed requests (when unhandled exceptions occurred). Lastly, the average response time for this method is displayed. The third label displays the number of exceptions that were thrown while executing this action method. This is extremely useful information when we're coding in Visual Studio. I know, all information can also be found in the portal, but it could happen that you'll not open that portal for a while. Now we don't even have to leave Visual Studio at all. All links in the CodeLens message box will open the Application Insights Search window where we can investigate the telemetry data further.
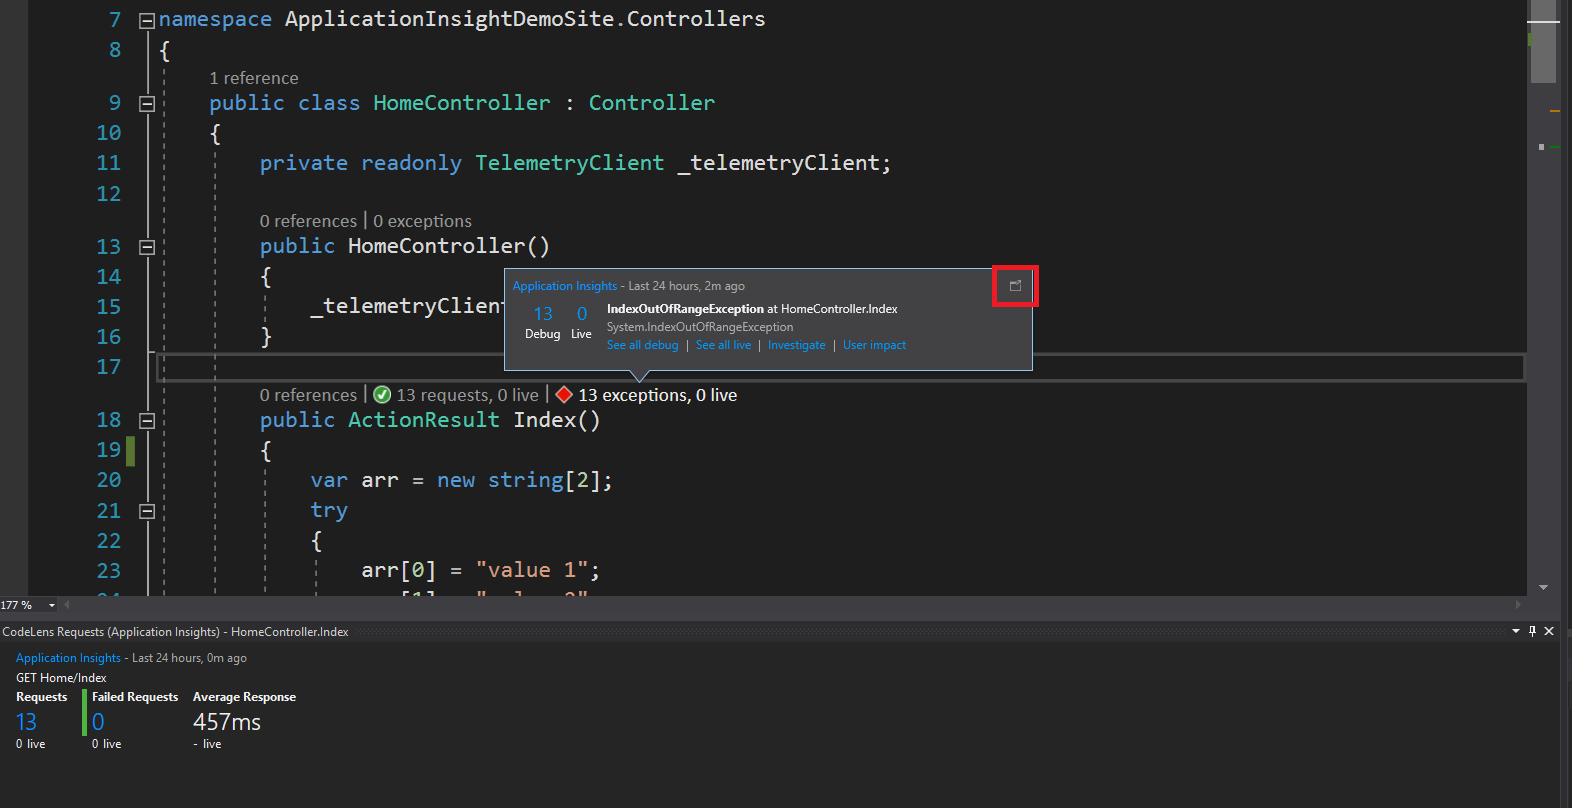
CodeLens displays telemetry data in two categories, debug and live. All telemetry data that's tracked while debugging your application will be show under the category Debug. The live category is, of course, all telemetry data that is tracked when the application runs in release mode.
The Application Insights integration in CodeLens is enabled by default. You could disable this feature in Visual Studio under: options -> Text Editor -> All Languages -> Code Lens -> Show Requests/Exceptions.
Let's refresh our memory again. In my previous blog, I used an example application to explain how you can solve exceptions with Application Insights. In the example, the visitor was able to select a category. An exception occurred when the visitor selected the 'Car' category and fill out the registration form. We found the cause of this exception by investigating the data in the Application Insights portal. Now, let's use CodeLens to find the same cause but in Visual Studio.
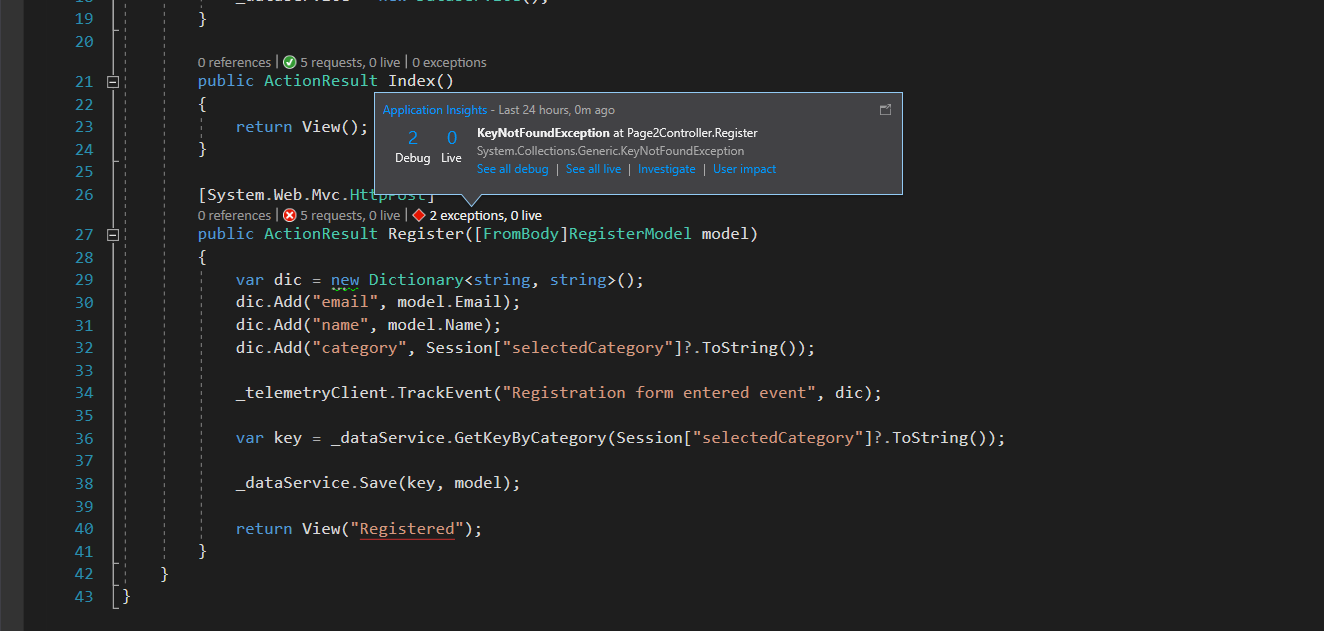
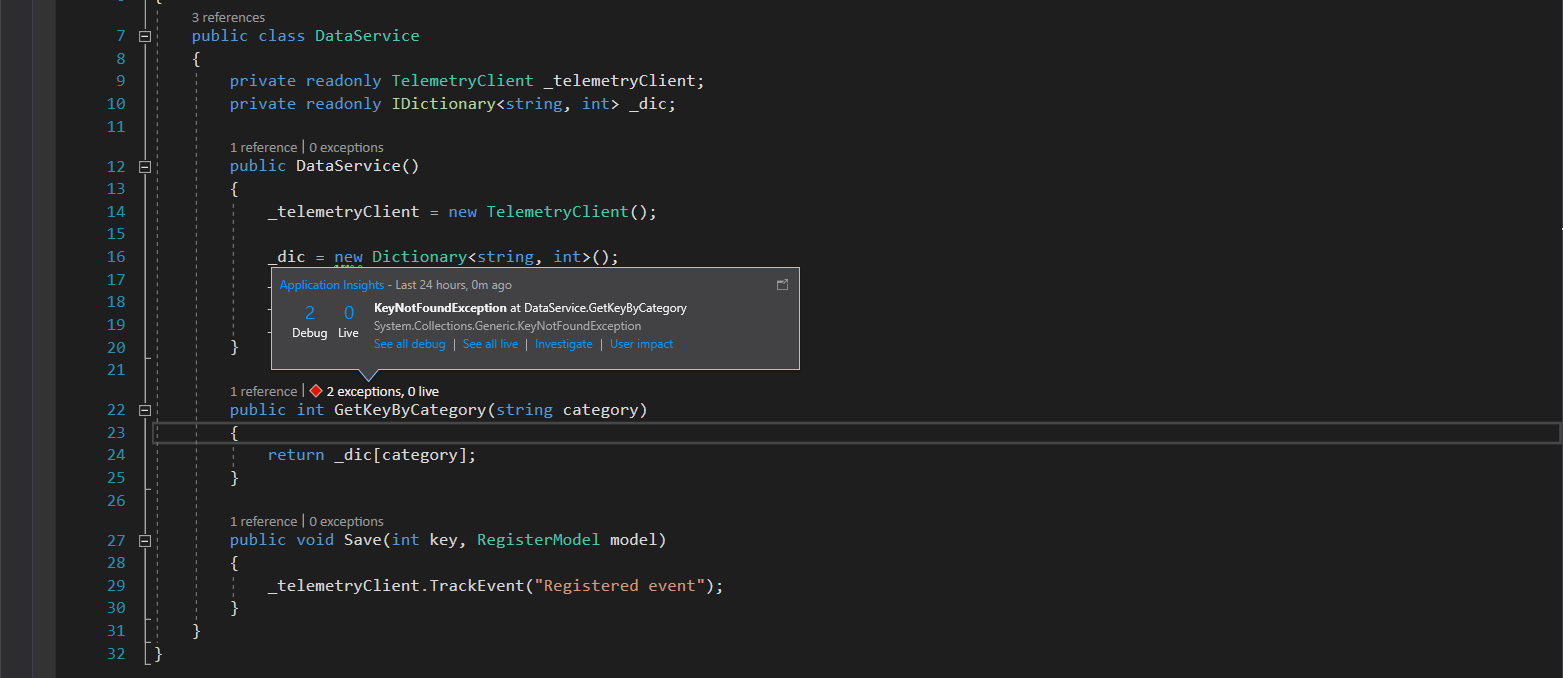
The first code snippet shows the Register action method. You directly see in CodeLens that exceptions occurred while executing this action method. When clicking on the exceptions label it will directly tell you the type of exception. You can't see which code line was causing the exception. If you click on 'see all debug' then the Application Insights Search window is opened. I will explain this later but basically, here we can find all kind of information about this exception including the stack trace. The label 'Investigate' opens the Application Insights Trends window. This window will tell you about trends in your application during specific time ranges. A trend could be an exception that is being thrown quite often. I'll cover the trends window in the next section.
Fortunately, I know that the actual exception is thrown in the DataService class. This is what you can see in the second code snippet. Here we find the same information, namely that a KeyNotFoundException occurred. The CodeLens labels tell us that there is only one reference to this method and that will be the Register action method.
The integration of Application Insights in CodeLens is pretty useful if you ask me. We don't have to leave Visual Studio to see what kind of exceptions are thrown and more important where in our code this is happening. CodeLens provides us a summary of what's happening in every method. This should trigger the developer, especially when exceptions occurred, to investigate the telemetry data further. It's not necessary to browse to the Application Insights portal, we can investigate the data without leaving Visual Studio. We've two options here, the Application Insights Trends and Search window.
Next, I'll explain how you can discover trends in Visual Studio.
What can you do with Application Insights Trends?
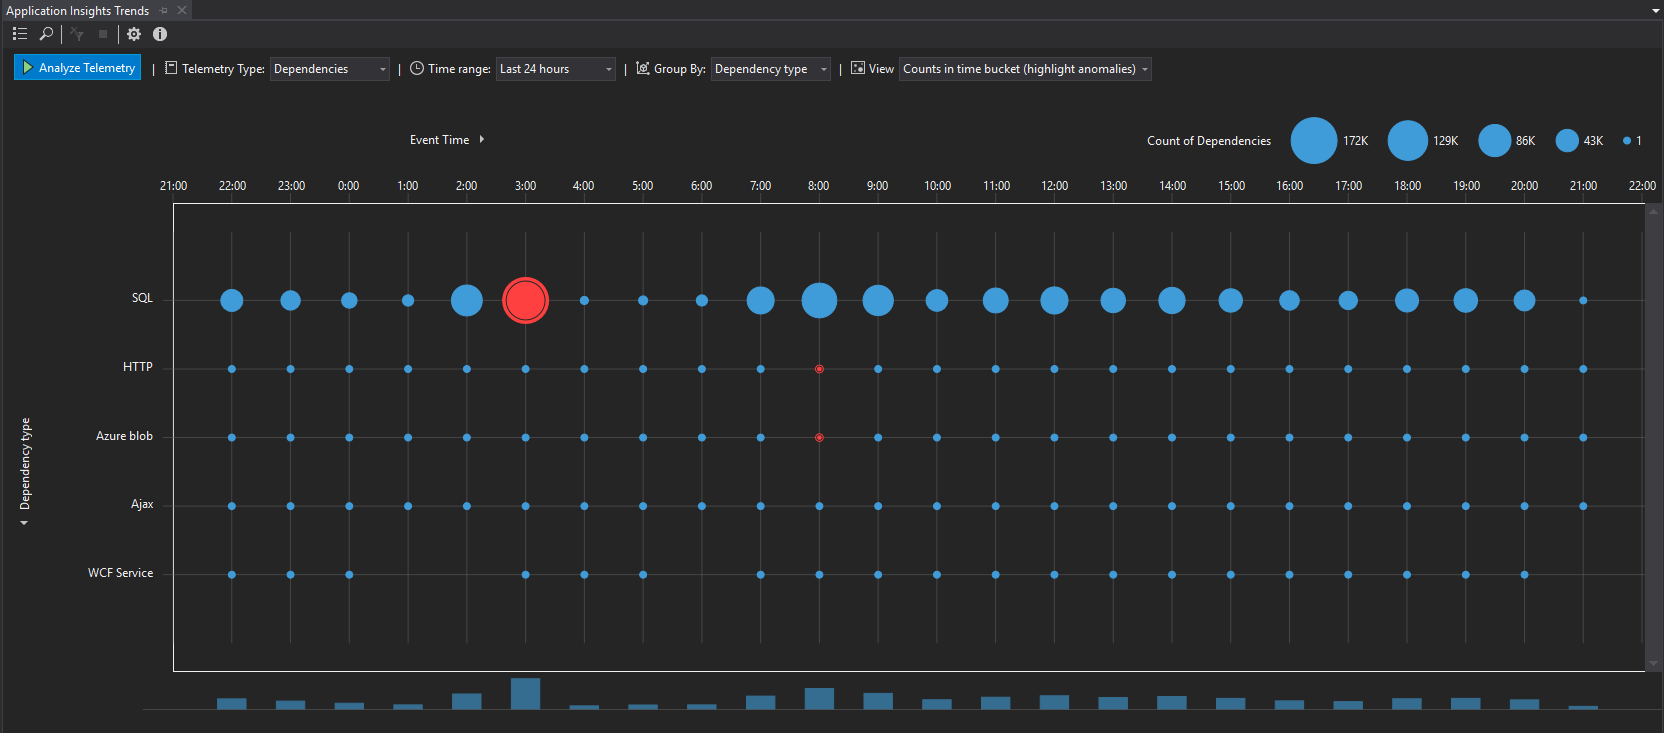
The Application Insight Trends window is part of Visual Studio. In this window, we can investigate telemetry data and discover trends in our application. In the chart, trends are displayed with a dot. The bigger the dot the more page visits, exceptions, dependencies calls, events, server requests or availability. These different telemetry types should be familiar now. So the dots in the chart indicates the activities in your application. This chart provides insights into the usage of your application for a specific time range. For example, you could see how often an exception is thrown and what the peak hours for your application are. The last can help you decide what the best time is for doing a production deployment.
We can customize the cart by setting different configurations.
Telemetry type
Application Insights tracks different kind of telemetry data: server requests, exceptions, dependencies, custom events, page views, availability.
Time range
Options we have here are last 30 minutes, hour, 4 hours,12 hours, 24 hours, 48 hours or last 3 days. It's not possible to go back further in time. Also not supported to select a time period.
Group by
As I explained in my previous blogs, telemetry data is tracked with a lot of meta information. So for exceptions, the type of exception, failed method and, problem ID is pushed to Application Insights. We can group the chart based on meta information.
View
We can investigate telemetry data in the chart from different perspectives. For example, when we display exceptions in the chart, we could count how often an exception occurred during a specific time range. We can also display this information in percentages. For example, between 10 AM and 11 AM two types of exceptions occurred, NullReferenceException and KeyNotFoundException. The NullReferenceException occurred 75% and the KeyNotFoundException 25% between 10 and 11 AM.
Basically, what you would do is discover trends (positive or negative) and then investigate further. For example, when you've selected the exceptions telemetry type you can right click a dot in the chart and search for instances of that exception. Now you will get a list of all instances and you can view the information for each individual item.
What I explained in the previous section is that you can open the Application Insights Trends window by clicking on the 'Investigate' label in CodeLens. In the screenshot below, you see some dots in the chart. In this case, the dots indicates the number of exceptions that were thrown in my example application. The bigger the dot the more exceptions. Extra information about the exceptions is displayed when you select a dot in the chart:
| Exception type |
How often the exception was thrown. |
| Problem ID |
The problem id which is a combination of exception type and location in the code where the exception was thrown. |
| Failed method | Methods that were affected. |
| Azure role instance | Azure role instances that were affected. |
| Country or region | Visitors that were affected grouped on country or region. |
| Application version | The current version of the application. By default, the application version isn't set for telemetry data. It is, of course, useful to see in which version of your application the exception occurred and if whether or not it was solved in later versions. I'll explain later in this blog how you can track the current application version. |
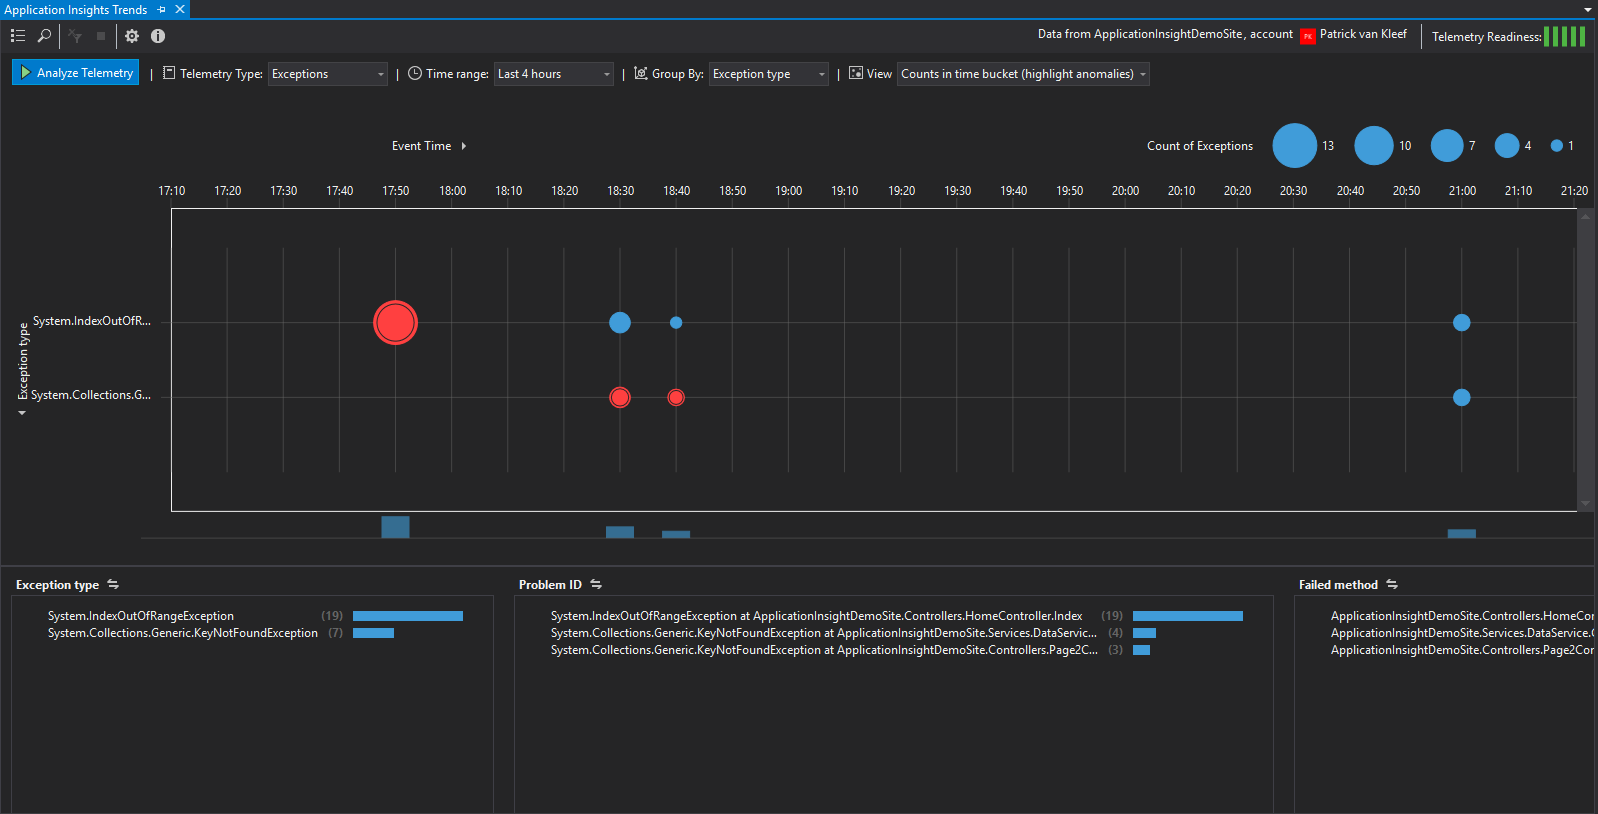
I think Application Insight Trends provides us, developers, a great dashboard which will trigger you to investigate and improve your application. What I explained in my previous blogs about Application Insights is that you can use the portal to browse, search and filter the telemetry data. Guess what, we can also do that directly from Visual Studio with the Application Insights Search window. The search window is opened when you double-click or right-click a red dot and select search instances. This window displays all instances for the selected exceptions. In the next section, I'll use the search window to investigate the exception we discovered in the trends window.
Browse telemetry data with Application Insights Search
The second useful window in Visual Studio is Application Insights Search. In the previous section, I explained that you can discover trends in your application with the trends window. When you want to investigate a trend even further you can open the Application Insights search window. This window gives you the ability to search/filter the trend or other telemetry data. Basically, this window provides the same functionality as the portal. Of course, a big plus is that we don't have to leave Visual Studio. When you search for exceptions you can immediately jump to the code that's causing the exception. Great developer experience if you would ask me!
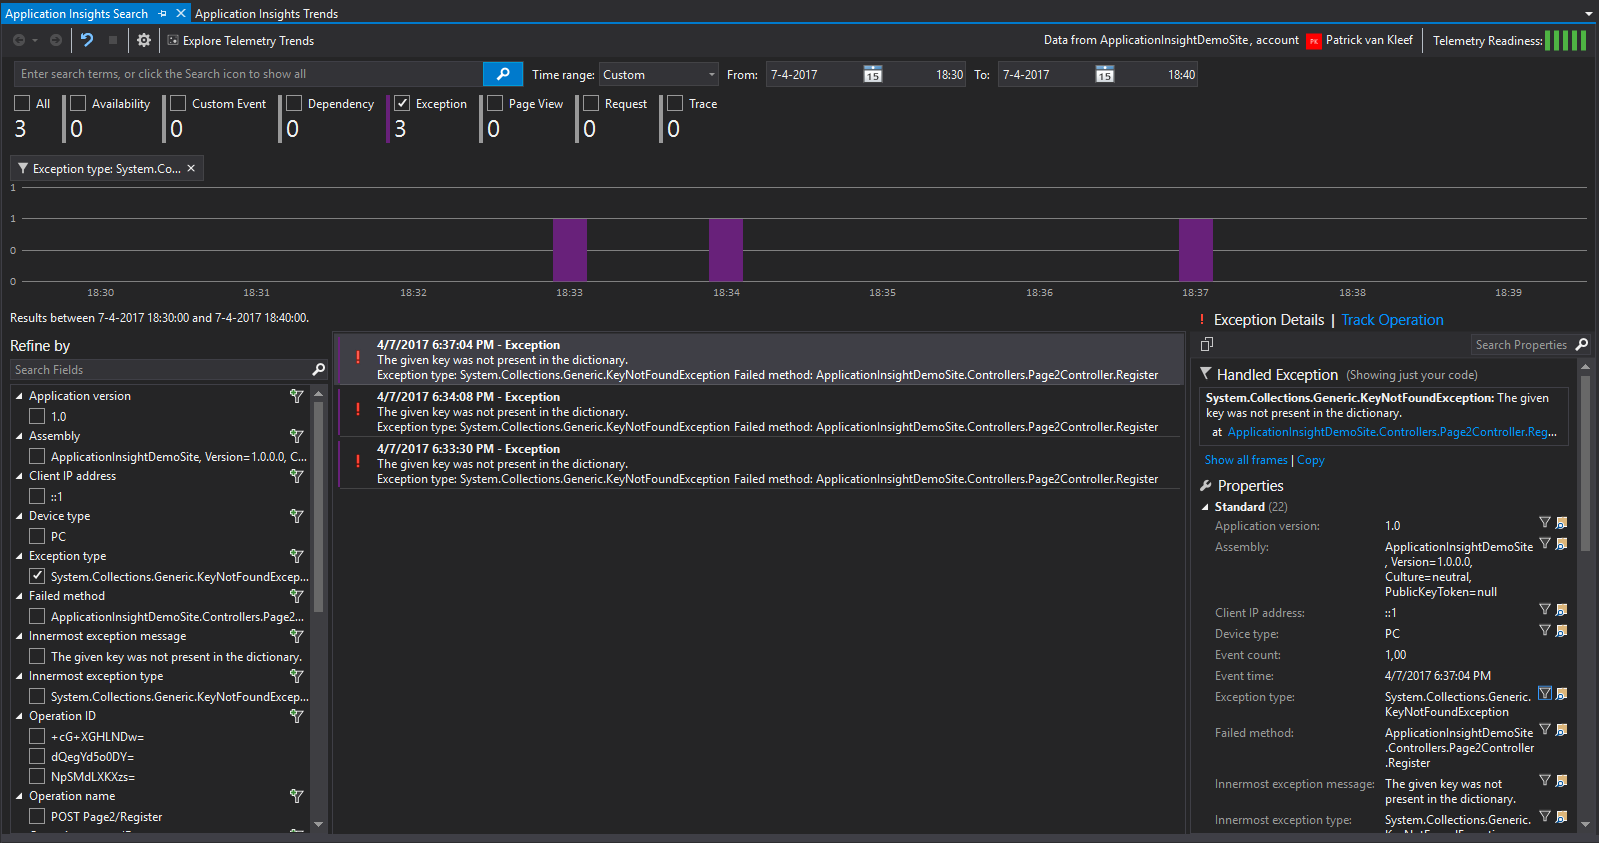
Let's investigate the exception or trend we discovered in the previous section. When we double click the dot in the trends window the search window in the screenshot is opened. At first, the information can be a bit overwhelming because this window offers a lot of features. Let's start with analyzing the screenshot. In the top, we find the search and filter functionality. Basically, the same functionality as in the portal. Underneath the search section, there is a time chart that displays when and how often the exceptions was thrown. We can filter on meta information on the left side. The center displays all instances of the exceptions. All detail information about an instance is displayed on the right side. If you compare this search window with the portal in Azure then one huge benefit is that we can jump directly to the causing code by clicking on the stack trace link. Now we can start solving the exception immediately and we can do this all without ever leaving Visual Studio. Credits to the Application Insights team for this great developer experience!
Every developer would like as many information as possible when solving exceptions or to figure out what's causing performance problems. The version of the application can be helpful to determine when an exception occurs or when performance problems started without going through the history of the source control. By default, the application version is not tracked but we can enable this by creating a telemetry initializer. I explain this in the next part.
Track the current version of the application
I mentioned in the previous section that it can be useful to track the current application version. You could compare telemetry data between different application version. This should answer questions like did the performance of my application improved? Was I able to reduce the number of requests to the server? Did I fix exceptions that were thrown in the previous version? We can do this all by tracking the current application version. In my previous blog, I explained how you can use telemetry initializers to enrich telemetry data with extra meta information before it's pushed to Application Insights. The ITelemetry interface represents a telemetry item that is pushed to Application Insights. The Application Insights NuGet packages contain 10 implementations of the ITelemetry interface:
- AvailabilityTelemetry
- DependencyTelemetry
- EventTelemetry
- ExceptionTelemetry
- MetricTelemetry,
- PageViewTelemetry
- PerformanceCounterTelemetry
- RequestTelemetry
- SessionStateTelemetry
- TraceTelemetry
Depending on the implementation (telemetry type), meta information is tracked. The Version property can be set for all telemetry types. This property is part of the component context (ITelemetry.TelemetryContext.ComponentContext). You would probably want to set that one for all telemetry data. Below an example code snippet how you could this.
public class ApplicationInsightsInitializer : ITelemetryInitializer
    {
        public void Initialize(ITelemetry telemetry)
        {
            telemetry.Context.Component.Version = "1.0";
        }
    }
You can configure a telemetry initializer either in the applicationinsights.config or in the global.asax during application startup.
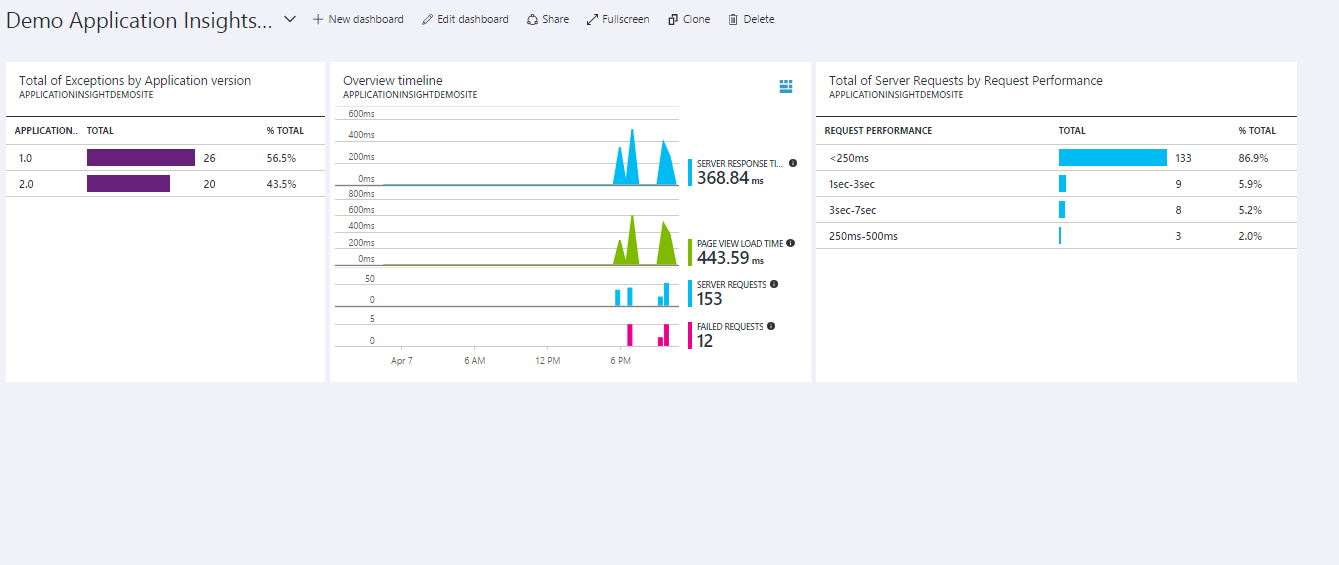
In Visual Studio, we can't create dashboards you'll do that in Azure. Below an example, where I pinned a grid chart containing the number of exceptions by application version. With this chart, I can compare the differences between versions of the application. For example, I can find out if the latest version performs better than the previous ones. By the way, we can create such a chart for all telemetry types e.g. server requests, page visits, dependencies, etc.
Tell Application Insight when you've deployed a new version of your application
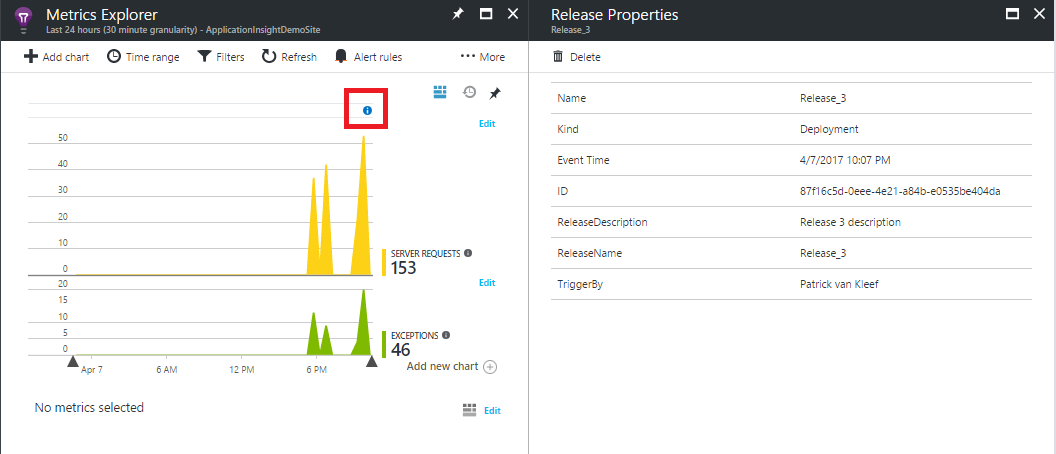
Ever wondered how your application performs right after a production release or what the impact is of a deployment? We can do so with release annotations. Annotations are visible in the metrics explorer in the portal of Application Insights. In the metrics chart, the are displayed as blue information icons. When you click on a marker it opens up a new blade with detail information about the deployment. This feature is well integrated into the VSTS deployment process. Follow the instruction in this blog.
You can also use a PowerShell script for creating release annotations. This script can be found here. Below an example how you can run this script.
.\CreateReleaseAnnotation.ps1 -applicationId "00000000-0000-0000-0000-000000000000" -apiKey "00000000000000000000000000000000" -releaseName "Release 1" -releaseProperties @{ "ReleaseDescription"="Release 1 description"; "TriggerBy"="Patrick van Kleef" }
When everything is configured in the deployment process you'll find annotations like the one in the screenshot above. You could now look at the server requests before and after the deployment to find out what the impact of a deployment is.
 Twitter
 LinkedIn
 GitHub