Use Application Insights to solve exceptions
In my previous blog, I explained in general what you can do with Application Insights. I also gave a short introduction how you use the API to track events and trace information. In this blog, I'll explain how exceptions are tracked and how Application Insights can be helpful for solving exceptions. Better said how you can actively monitor your application to discover and solve exceptions before your customer reports them. It's always a pain to solve a reported issue without a detailed description. Probably you'll end up trying some things yourself until you can reproduce the issue. Application Insights to the rescue! Application Insights collects a lot of information about exceptions, but sometimes you'll notice you miss some information. By using the API to track extra information, you definitely will have a great tool that will provide you all the information you need. Based on some examples I'll guide you to through the possibilities.
Later in this blog, I'll explain based on an example how you use Application Insights for solving exceptions.
Track exceptions
All requests that throw an exception are tracked by Application Insights. You don't have to configure anything for that. When the NuGet packages are installed, you'll notice that the AiHandleErrorAttribute class is placed in the ErrorHandler folder. This class can be used in two ways. Since this class inherits from HandleErrorAttribute you can decorate a controller with this attribute. Each time an exception is thrown this class attribute will track the exception. You can also use the AiHandleErrorAttribute as exception filter since this class also inherits from IExceptionFilter. So if you want to use this class for all controllers, you can register it as an MVC exception filter.
[AttributeUsage(AttributeTargets.Class | AttributeTargets.Method, Inherited = true, AllowMultiple = true)]
    public class AiHandleErrorAttribute : HandleErrorAttribute
    {
        public override void OnException(ExceptionContext filterContext)
        {
            if (filterContext != null && filterContext.HttpContext != null && filterContext.Exception != null)
            {
                if (filterContext.HttpContext.IsCustomErrorEnabled)
                {
                    var ai = new TelemetryClient();
                    ai.TrackException(filterContext.Exception);
                }
            }
            base.OnException(filterContext);
        }
    }
public class FilterConfig
{
public static void RegisterGlobalFilters(GlobalFilterCollection filters)
{
filters.Add(new ErrorHandler.AiHandleErrorAttribute());
}
}As you can see the AiHandleErrorAttribute class only tracks exceptions when the custom errors in the web.config are enabled. By default, all unhandled exceptions are tracked by the ApplicationInsightsHttpModule. This module is configured in the applicationinsights.config.
<TelemetryModules>
      <Add Type="Microsoft.ApplicationInsights.DependencyCollector.DependencyTrackingTelemetryModule, Microsoft.AI.DependencyCollector" />
      <Add Type="Microsoft.ApplicationInsights.Extensibility.PerfCounterCollector.PerformanceCollectorModule, Microsoft.AI.PerfCounterCollector"></Add>
      <Add Type="Microsoft.ApplicationInsights.Extensibility.PerfCounterCollector.QuickPulse.QuickPulseTelemetryModule, Microsoft.AI.PerfCounterCollector" />
      <Add Type="Microsoft.ApplicationInsights.WindowsServer.DeveloperModeWithDebuggerAttachedTelemetryModule, Microsoft.AI.WindowsServer" />
      <Add Type="Microsoft.ApplicationInsights.WindowsServer.UnhandledExceptionTelemetryModule, Microsoft.AI.WindowsServer" />
      <Add Type="Microsoft.ApplicationInsights.WindowsServer.UnobservedExceptionTelemetryModule, Microsoft.AI.WindowsServer" />
      <Add Type="Microsoft.ApplicationInsights.Web.RequestTrackingTelemetryModule, Microsoft.AI.Web">
        <Handlers>
          <Add>System.Web.Handlers.TransferRequestHandler</Add>
          <Add>Microsoft.VisualStudio.Web.PageInspector.Runtime.Tracing.RequestDataHttpHandler</Add>
          <Add>System.Web.StaticFileHandler</Add>
          <Add>System.Web.Handlers.AssemblyResourceLoader</Add>
          <Add>System.Web.Optimization.BundleHandler</Add>
          <Add>System.Web.Script.Services.ScriptHandlerFactory</Add>
          <Add>System.Web.Handlers.TraceHandler</Add>
          <Add>System.Web.Services.Discovery.DiscoveryRequestHandler</Add>
          <Add>System.Web.HttpDebugHandler</Add>
        </Handlers>
      </Add>
      <Add Type="Microsoft.ApplicationInsights.Web.ExceptionTrackingTelemetryModule, Microsoft.AI.Web" />
    </TelemetryModules>
Track handled exceptions
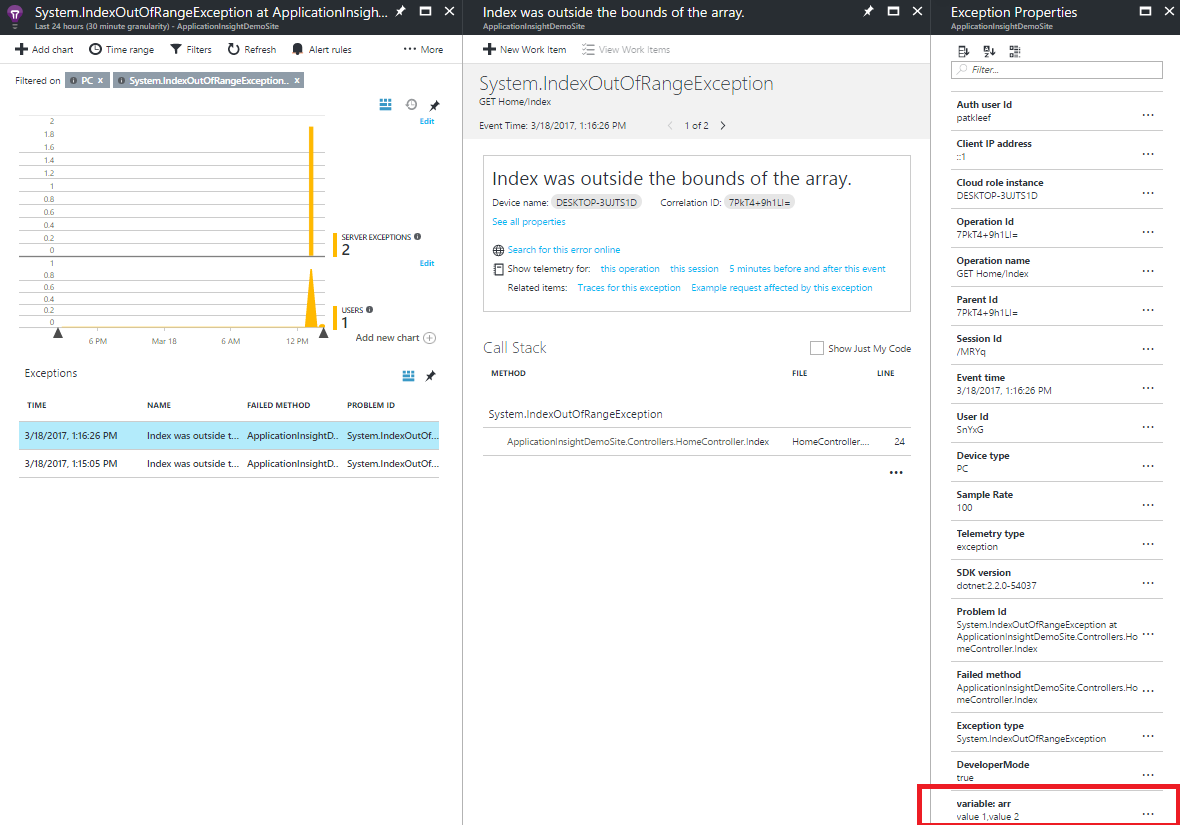
In many occasions, you'll handle exceptions yourself with a try/catch block. Obviously, something that you should do. The only problem is that handled exceptions are not being tracked. Note that the AiHandleErrorAttribute and ExceptionTrackingTelemetryModule only track unhandled exceptions. So you need to do this yourself by using the API. In my previous blog, I explained how you can track events and trace information either by using the C# or JavaScript API. Exceptions can also be tracked with the API. This is what you want to do for handled exceptions. Let's look at the code snippet below. You'll immediately see that this will throw an 'Index was outside the bounds of the array' exception. Since I'm handling this exception myself with a try/catch block, neither the ApplicationInsightsHttpModule nor the AiHandleErrorAttribute will push this exception to Application Insights. I need to this myself by using the API. In my constructor, I've created a new instance of the TelemetryClient class, Microsoft recommends to use only one instance of the TelemetryClient per module of your application. To push the exception I need to call the TrackException and pass the exception object. Optionally I can pass some additional information about the exception. In this example, I pass information about the array to provide more detail information.
public ActionResult Index()
    {
        var arr = new string[2];
        try
        {
            arr[0] = "value 1";
            arr[1] = "value 2";
            arr[2] = "value 3";

            var result = arr[3];
        }
        catch (Exception ex)
        {
            var dic = new Dictionary<string, string>();
            dic.Add("variable: arr", string.Join(",", arr));

            _telemetryClient.TrackException(ex, dic);
        }
        return View();
    }
Exceptions in Application Insights
The portal of Application Insights provides us an interface for monitoring exceptions that occur in our application. Under 'Investigate' you can open the Failures blade. Note that all blades contain the same searching and filtering features. We can drill down the data by providing a time range and apply filters. In the screenshot below, you can see the exceptions from three different perspectives. First, all requests that returned the response codes 404, 500, etc. We can click on each (request) operation name and see all exceptions that were thrown for that operation. Secondly, all dependency exceptions. Examples of dependency exceptions are failed HTTP requests or database queries that thrown an error. Lastly, an overview of all exceptions grouped by type.
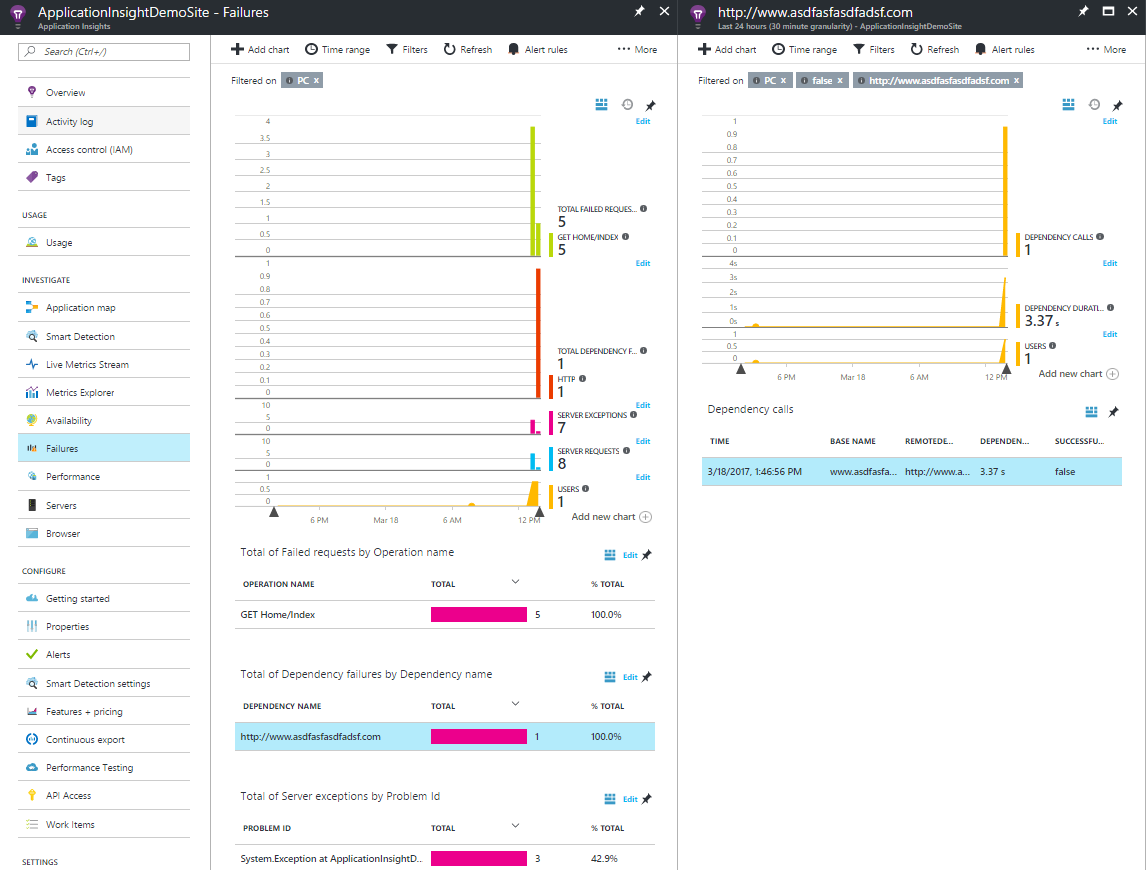
By clicking on an exception the portal provides extra information, as you can see in the screenshot below. For example, here you'll find the stack trace which is helpful for locating the exception. Except for the meta information that's provided by Application Insights by default, there is also the possibility to push additional information for an exception. As I explained earlier, you can use a Dictionary<string, string> object to pass additional data. The additional data is displayed at the bottom of the Exception Properties blade.
How Application Insights can help you reproduce exceptions
It's often difficult to reproduce errors that are reported by customers or end users. Especially when the reported issue only contains a few lines of explanation. In that case, you would try to reproduce the exception in the application yourself. The next step would be checking if you can find some relevant information regarding the exception in the log file. A log file can grow rapidly, this makes it harder to locate an exception.
What I've shown and explained earlier is that Application Insights is a great tool for investigating exceptions that have been thrown. Especially with all searching and filtering capabilities. In this section, I'll explain, how you can investigate a particular session and how this can be helpful to reproduce the steps a visitor took before an exception was thrown. I'll try to explain this on the hand of an example that I've created.
In the demo, a visitor can do a registration. On the 'Select category' page the visitor is able to select a category. This category will be used as part of the registration. On the 'Register' page the visitor needs to fill out the fields. Based on the selected category extra fields are shown. A registration contains the values that have been entered in the fields and the selected category on the 'Select category' page. Apparently, the registration fails when the car category is selected, see the animated gif.
Let's forget the fact that we know when (car category is selected) the registration fails. Only thing what we know is that some visitors complained that the registration page is not working.
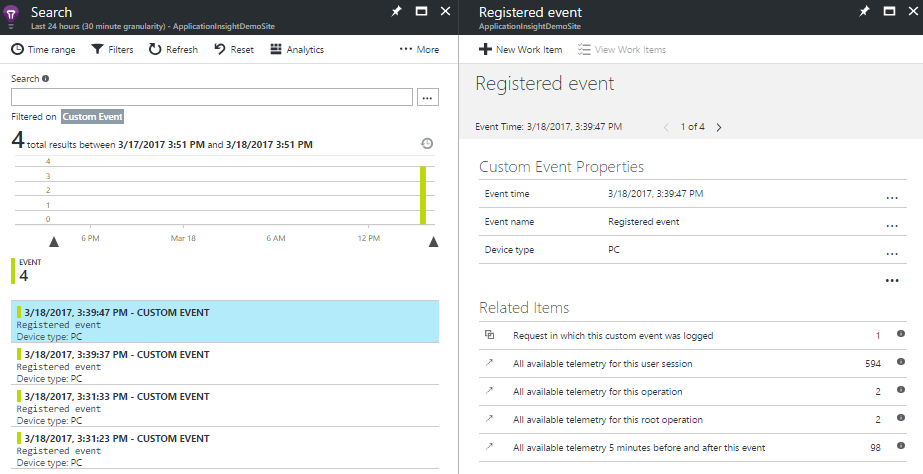
In my demo application, I'm using the API to track extra telemetry data. For instance, I'm pushing a custom event when a visitor completes a registration. So the first step in solving this issue is checking Application Insights if we can find events that indicate successful registrations. In this case, there have been some completed registrations (screenshot below). That means the issue only happens occasionally. It probably has something to do with the data that's entered by the visitor. Fortunately, Application Insights tracks telemetry data of user sessions.
Investigate telemetry data for a user session
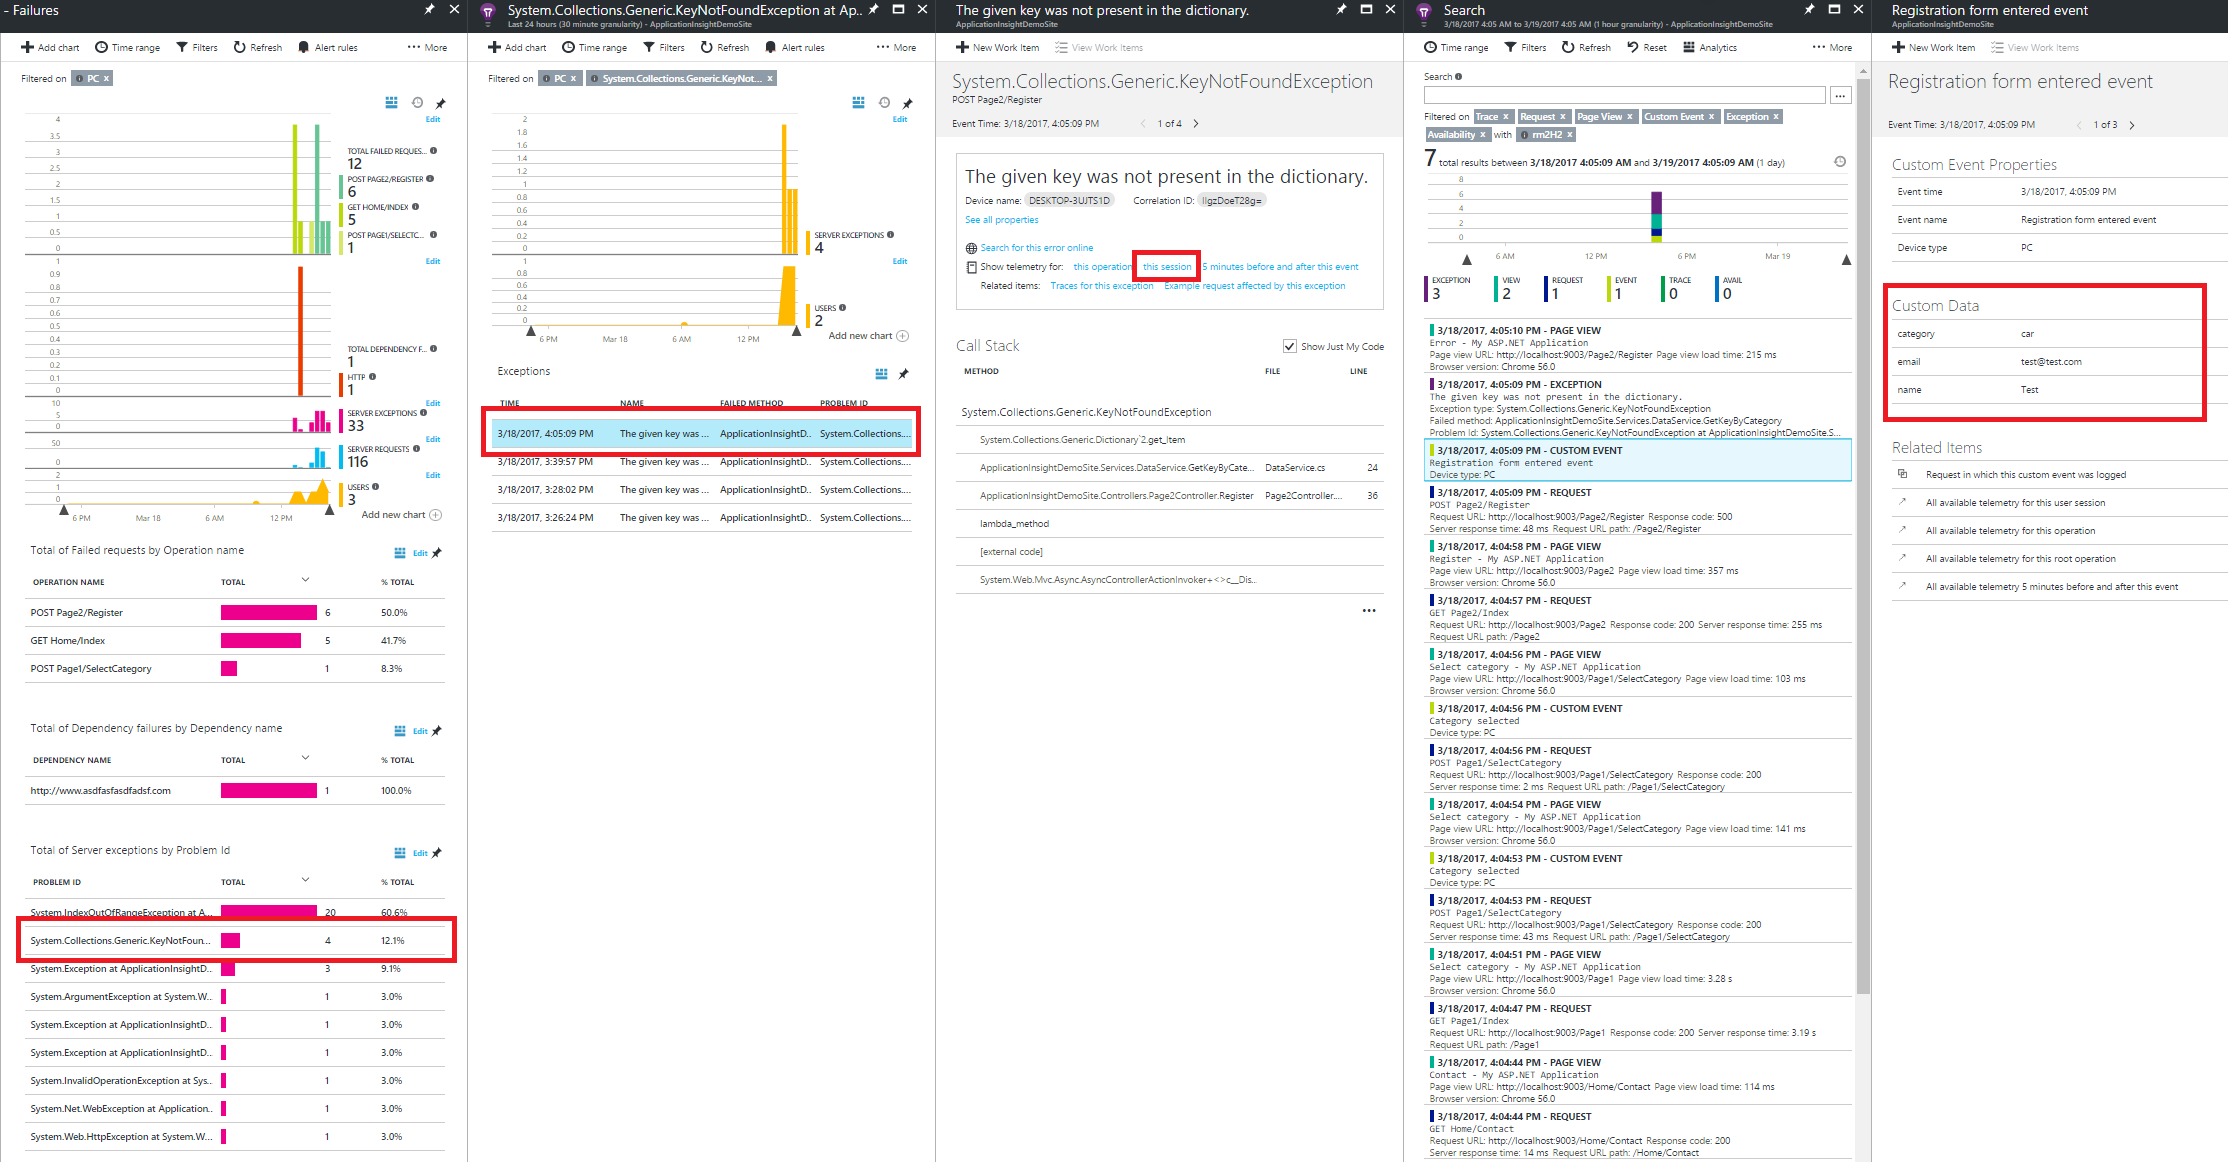
In Application Insights, we can investigate telemetry data for a single user session. If we continue with our registration problem, we can use this feature of Application Insights to find out which steps the visitor took before an exception was thrown. What I already mentioned is that we can select the 'Failures' blade for investigating all exceptions. In this blade, we will find the System.Collections.Generic.KeyNotFoundException exception. By clicking on this exception, we will get an overview of how many and when this exception occurred. If we select a specific exception all detail information is shown in a new blade. The KeyNotFoundException indicates that I'm trying to get an item of a dictionary by a key that doesn't exist. Now up for the interesting part. When we click on the 'Show telemetry for this session' link we will get a nice overview of all telemetry data for that user session. (click on the screenshot below to display a larger image)
Let me summarize the tracked telemetry data for this user session:
- Home page - page view
- About page - page view
- Contact page - page view
- Select category page - page view
- Post Page1/SelectCategory - request
- Category selected - event
- Category selected - event
- Registration page - page view
- Post Page2/Register - request
- Registration form entered event - event
- The given key was not found present in the dictionary - exception
I'm tracking two custom events. First, when the visitor selects a category. For this event, I'm also pushing the selected category as additional data. Secondly, when the registration form is completed by a visitor I push an event with all entered data. When I investigate the telemetry data for this user session I can conclude that the registration only fails when the visitor selects the car category. When the visitor selects another category everything just go fine.
The exception in Application Insights also includes the stack trace information. Apparently, I made a typo in my code what was causing this exception.
[System.Web.Mvc.HttpPost]
    public ActionResult Register([FromBody]RegisterModel model)
    {
        var dic = new Dictionary<string, string>();
        dic.Add("email", model.Email);
        dic.Add("name", model.Name);
        dic.Add("category", Session["selectedCategory"]?.ToString());

        _telemetryClient.TrackEvent("Registration form entered event", dic);

        var key = _dataService.GetKeyByCategory(Session["selectedCategory"]?.ToString());

        _dataService.Save(key, model);

        return View("Registered");
    }
public class DataService
{
private readonly TelemetryClient _telemetryClient;
private readonly IDictionary<string, int> _dic;
public DataService()
{
_telemetryClient = new TelemetryClient();
_dic = new Dictionary<string, int>();
_dic.Add("house", 0);
_dic.Add("carr", 1);
_dic.Add("work", 2);
}
public int GetKeyByCategory(string category)
{
return _dic[category];
}
public void Save(int key, RegisterModel model)
{
_telemetryClient.TrackEvent("Registered event");
}
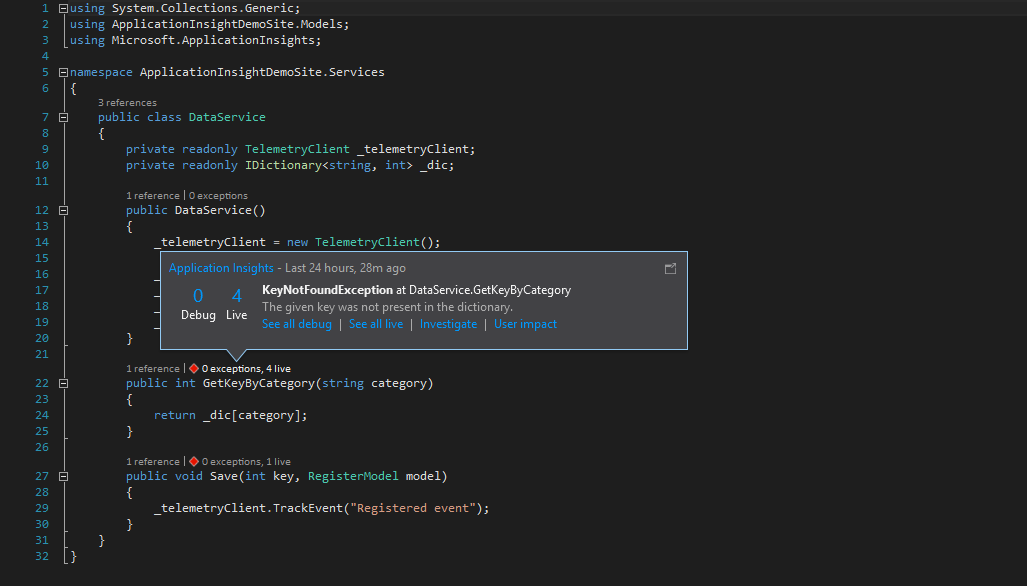
}In the register action method, I'm tracking an event with all post variables. The GetKeyByCategory method of the DataService class is throwing a KeyNotFoundException. In that method, I'm trying to get an item of the local variable _dic. Problem is that I made a typo in one of the keys, I've defined 'carr' instead of 'car'.
Application Insights is well integrated into Visual Studio. I can click the exceptions label above the GetKeyByCategory method to get an overview of all exceptions that occurred. This popup includes some action links to investigate the exception.
Summarize
With Application Insights, you can monitor exceptions that occurred in your application. By default, all unhandled exceptions are tracked. When you install the Application Insights NuGet package, the ExceptionTrackingTelemetryModule and the AiHandleErrorAttribute are responsible for tracking the exceptions. If you handle exceptions yourself with a try/catch block you can use the API to track those exceptions. Another great feature from Application Insights is the ability to see all telemetry data from a single user session. This can be valuable information to reproduce an exception and to investigate what steps the visitor took before the exception was thrown. Overall I think Application Insights provides many benefits for solving exceptions. It definitely gives you more insights in the exceptions that occur in your application, but even more important it provides valuable information to solve exceptions. That's something which can save developers a lot of time.
 Twitter
 LinkedIn
 GitHub